Hello World for Brain-Computer Interfaces
Published December 31, 2020
Hello! I'm gonna tell you everything I know about the most consistently evoked signal in all of EEG and how to detect it — the closed-eye alpha wave spike.
Detecting whether eyes are open/closed using #EEG alpha wave activitypic.twitter.com/OnwhTsJSsa
— Andy (@redlightguru) December 31, 2020
This alpha wave signal is used to confirm that EEG electrodes are set up to sample brainwaves properly, and not just sampling the atmosphere's noise (which unfortunately looks a lot like passive brainwave activity).
Because the spike in alpha wave activity happens when your eyes are closed, this makes personally seeing it rather hard — you have to do a screen record or otherwise plot the amplitude to be able to see the spike after you've opened your eyes.
Experimental Setup
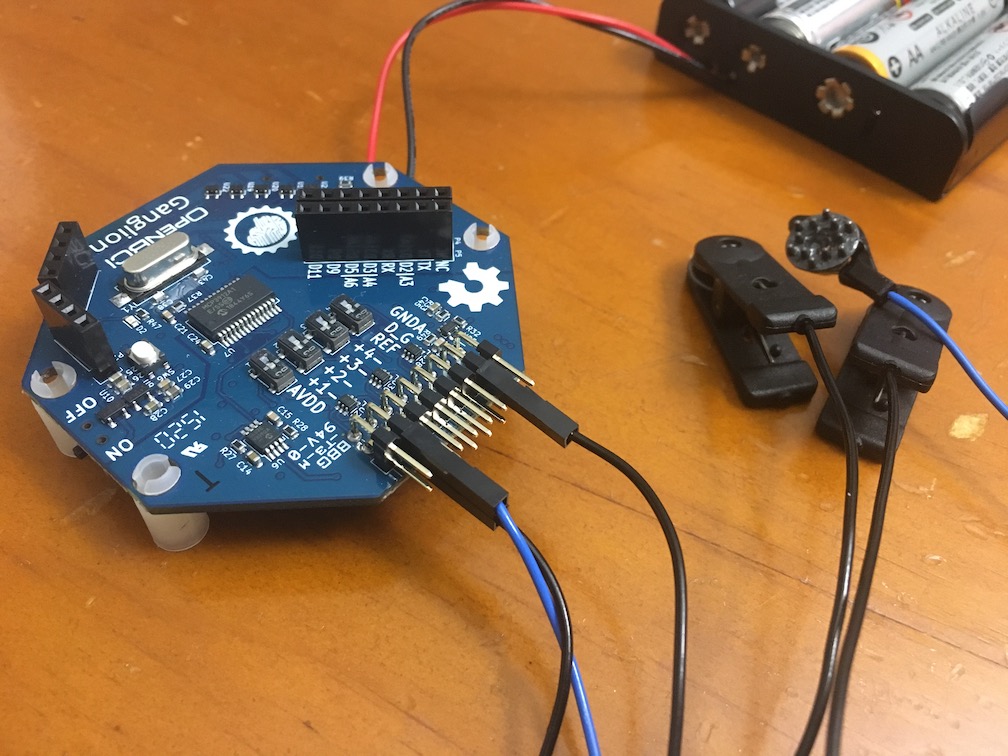
Data are being recorded on a single channel of the OpenBCI Ganglion EEG board. The electrode placements are as follows: GND on right earlobe, Channel 1 (-) on left earlobe, and Channel 1 (+) on position Oz of the 10-20 international system.
Oz is right over the occipital region of the brain, near the bump on the middle-back of your head (this is called the inion). Sample rate is 200Hz, safety from being shocked in the brain by mains insured by the board streaming samples to my laptop over Bluetooth.
Picture of the Ganglion board, with two earlobe electrodes and the scalp electrode. It's spiky to go through hair
Once streamed onto the computer over BrainFlow (I made another blog post about that), the data are filtered using SciPy's IIR filters. Mainly, a 60Hz notch filter and 5-75Hz bandpass filter, with 40dB attenuation for the stopband. These are applied with the scipy.signal.filtfilt() function. I don't know if the dB number is like power (div by 20 then take the logarithm) or normal (div by 10 then take the logarithm), but the stopband is completely flat either way so I don't really mind.
FFT is calculated using Welch's method. Alpha band integration is as simple as adding up all the magnitude contributions from frequencies in the band 7-13Hz, but Brainflow has a built-in function for doing this (if you use this, make sure you feed in the tuple as (power, freqs) instead of the (freqs, power) that scipy.signal.welch() gives you). That's it!
Implementation: I'm creating a live plot using a matplotlib animation. The indicator is drawn on-graph as both text and an emoji.
Results
Eyes closed are pretty reliably detected by a spike, with a lag of about a second. Eyes opening, the alpha waves drop about as fast as they rise. This is probably due to my EEG data window being 5 seconds, since I'm not doing any averaging that would otherwise slow it down.
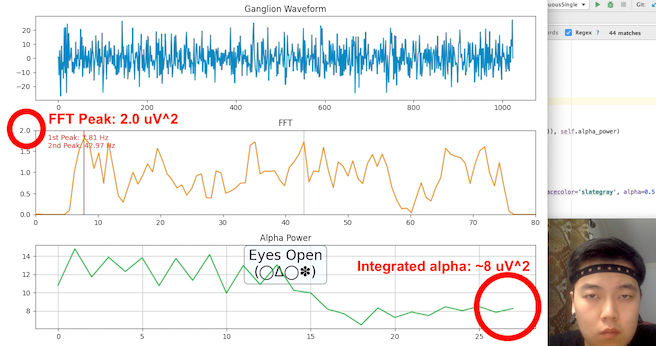
Graph of baseline alpha wave activity
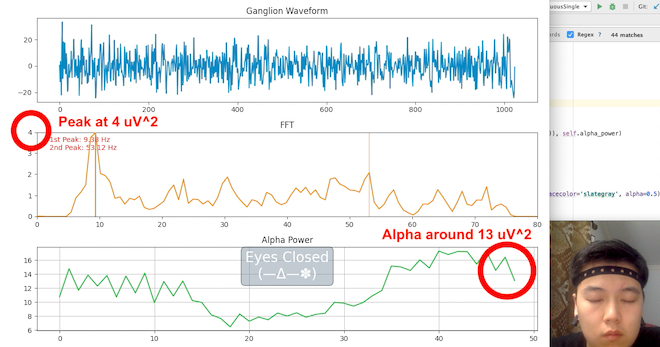
Vastly increased alpha wave activity when user's eyes are closed
Reliability problems
Within session, I had no problems with reliability. I saw my average alpha activity around 8 uV^2, and it went above 12 or so with my eyes closed so I set that as the breakpoint. However, alpha activity also decreases with increase in drowsiness, and I finished this pretty late last night, so it could not work for me right now (not drowsy) the way the breakpoints are set.
I believe the baseline alpha activity varies from person to person, so the threshold would probably have to be adjusted for new people.
I think that's it for now. Follow me on Twitter!