Improving noisy EEG data through single channel averaging
Published December 18, 2020
So I'm working with some EEG data, right? The kind collected by these caps. I'm gonna show you how to improve your signal-to-noise ratio from single channel EEG, specifically for detecting continuously repeating weak signals.
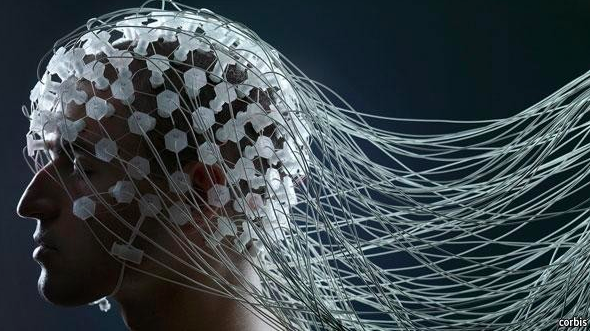
Traditional EEG cap
Background you need to know about EEG
Skip this part if you already know about notch filters at 50/60 Hz -.-
EEG (electroencephalography) is a technique for measuring brainwaves emanating from the firing of thousands of neurons under your skull. When used noninvasively, it measures the clumped firings by taking a voltage potential measurement on the surface of the skull. We can use some of these brainwaves that are predictable (or unpredictable) to control devices. These signals, or potentials, are the first brain-computer interfaces.
Traditional EEG noise reduction techniques
All EEG data is super noisy, and I'm not just saying that to excuse the fact that my data is super noisy. People solve this by using great analog electrical engineering or by averaging a bunch of different sites on the head. Think about it; if the noise is Gaussian random, and you measure the same spot on the head for the same signal 100 times and average all of them together, then the noise goes down by a factor of 10! Amazing!
Unfortunately, electrodes take linear time to put on, and it's difficult to find 100 spots for electrodes on your head at all, much less at the same spot. So what happens instead? Well, we can repeat a stimulus a few times, and average those.
If the stimulus is fast enough, we get to do this a few 10s of times in a few seconds, and reduce our noise by a decent amount. Combining this with multiple amplifiers, and you get almost the same thing as 10x decrease in noise.
What's the catch?
The catch is that this technique is usually only applied to triggered potentials like the P300 or increase in alpha wave activity. When the user activates a stimulus, like seeing a card or closing their eyes, the trial starts. Then, averaging a few trials, the data becomes usable. This takes forever — a minute or so, and is COMPLETELY UNUSABLE in the real world.
It's also difficult to do with just one channel, for the reasons mentioned above. Multiple channels just makes it easier
My use case
OK, I admit it. I'm trying to detect the SSVEP, or the steady-state visually evoked potential. Read more about it here. Basically, if you look at a light blinking from 10-20Hz, there's a very clear peak at that frequency in the EEG data measured over your visual cortex.
However, it's a continuous signal, so I can't "time" when it starts and stops. I'm trying to do single channel SSVEP detection, instead of multi-channel. And, this signal is weak above 15Hz, and I'm looking for it at 35Hz. That's the opposite of most traits that make it easier to find.
I'll show you my data. I'm looking for the 35Hz signal content of this brainwave. Top graph shows the waveform, measured over 40 sec, and bottom graph shows the power spectral density of the top graph (Basically the Fourier transform).
35Hz signal from EEG DROWNED in noise
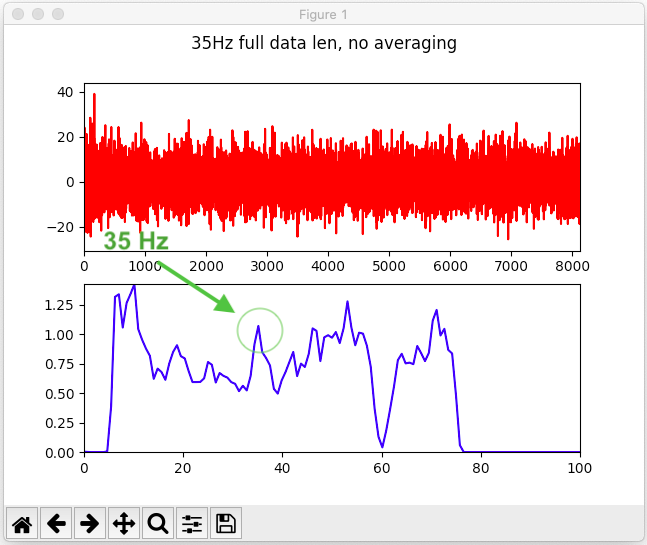
You can barely see the peak at all, much less differentiate it from any adjacent peak! I mean, it's high, but it's not that high, and it is surrounded by taller brothers.
What if I told you there was a way I could make that graph into this one?
35Hz signal from EEG clear as day
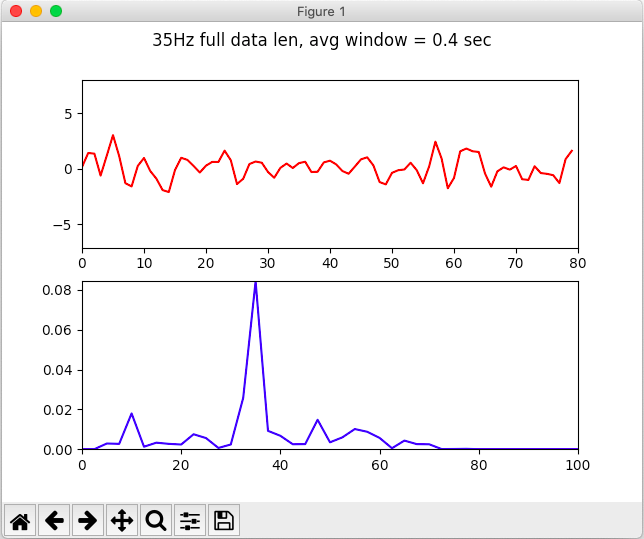
That's a much nicer looking peak, isn't it?
The catch pt 2
I'm using 40 seconds of data here. NO WAY anyone sits still for 40 sec allowing you to collect their brainwaves to control something. But I'm going to show you that this still works with a much smaller window of 3 seconds, which I think makes a usable BCI
How to do single channel noise averaging
This technique takes advantage of the fact that a single channel of this EEG data oscillating at 35Hz repeats itself every second. Well, it repeats itself every 1/35 second to be more exact. What we can do is average over a window that contains an integer multiple of full waveforms (1/5 sec, 1/7 sec, 1/35 sec, 1 sec), and if the signal exists at all it will be amplified, and any other signal will be destroyed. Then we can take the FFT of it, and figure out what frequency we're looking for.
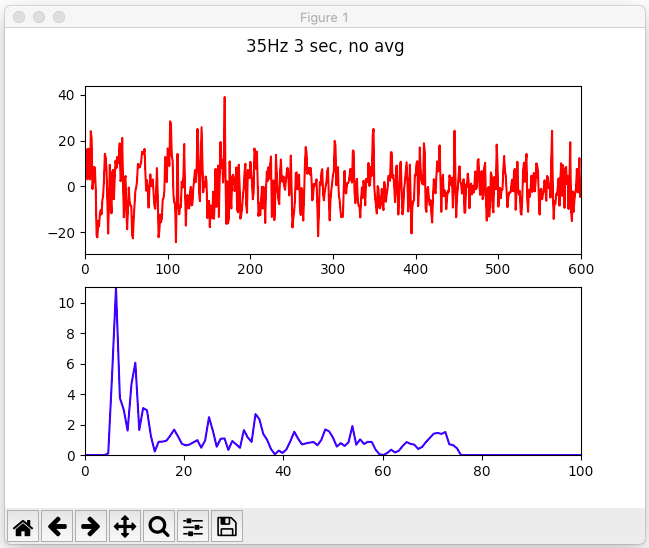
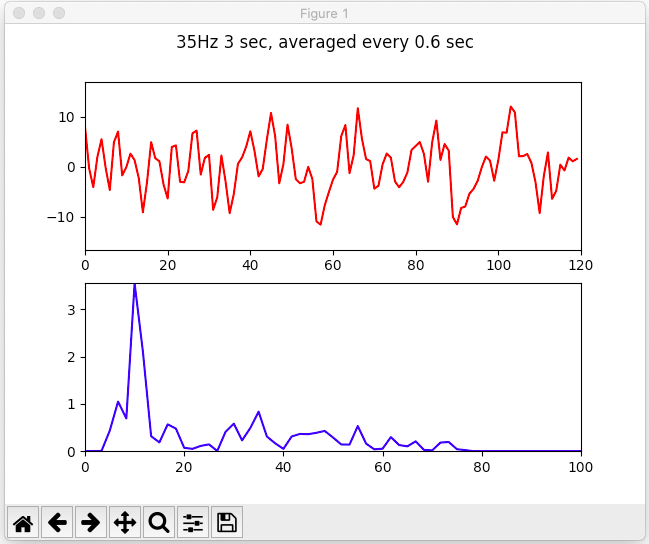
Here's an example using a shorter chunk of data, 3 seconds. We see that with no averaging, the 35 peak rivals the 25Hz peak, and both are dominated by the <20Hz peaks.
A raw 3 second clip from our wave shows no 35Hz prominence
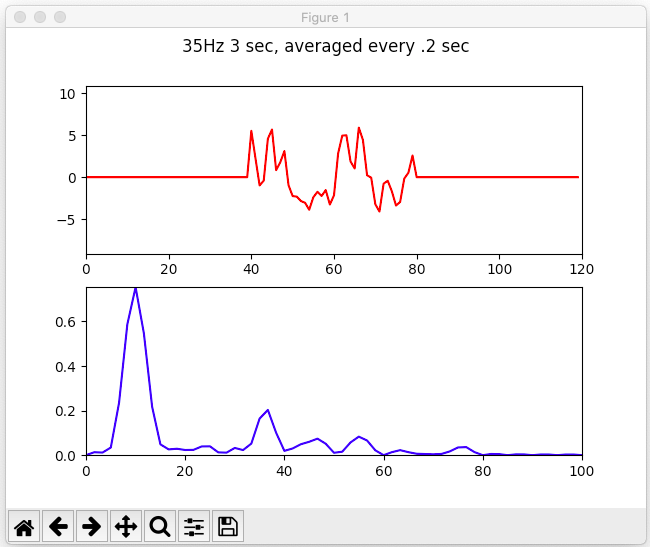
However, with averaging, the 35Hz peak is much higher than the 25Hz. While still lower than the high peak, we can just constrain the search space to >20Hz frequencies, and this will give us the answer we want. What else can we do to make ths more apparent?
An averaged 3 second clip from our wave shows slightly higher 35Hz peak, but nothing amazing
Actually, to fix this, you can increase the FFT resolution (not really because of math or whatever it's really just sine interpolation but it looks like it, okay?) by padding the data with zeros!
Animation of the FFT resolution increasing in front of our very eyes by using zero-padding
if you change the window size and pad with zeros on both sides, the signal becomes very nicely defined, and the 35Hz is almost trivial to detect.
Well-isolated 35Hz signal from our previously noisy-as-hell data using single channel averaging and zero-padding
Caveats pt 3???
These are not cherrypicked examples, they're just the first 3 seconds of my collected data.
I tried this with other starting positions and it is a bit finicky (all BCI stuff is), but the principle is still sound. For me, if one section didn't work, an adjacent one usually did.
One problem is other multiple of 5 frequencies also compound when your window is a multiple of that size (I used 0.2 and 0.6 sec windows mostly), though the zero padding helps with that.
Conclusion
I haven't seen this mentioned in the literature (if you had, please email it to me!). Since the SSVEP is so weak at higher frequencies but the number of waveforms appears more often, this should make high-frequency SSVEP detection much easier. Anyway, I hope you found this useful, and/or interesting. If so, smash that like button. Cya!!