Histogram Equalization
Published November 20, 2020
I recently found out about histogram equalization. Let me tell you about it! So first,
What's a histogram?
A histogram is just a graph of the intensity values within an image. To construct it, let's assume you have an 8-bit image whose intensities span 0-255. You create a 256-length array full of zeros. Then, you go through your image pixel by pixel. We use its value as an index, and increment the number in that array position. In the end, you'll have an array of the counts of how many times we've seen each pixel value. Here's an example.

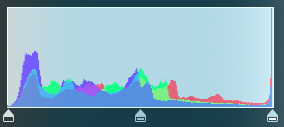
It allows you to visualize the relative range/span of the pixels in your image, whether the image is mostly darks or mostly lights. You can (hopefully) already see that with your eyes, but this is a more technical way of seeing it.
So what's histogram equalization?
Let's look at an overexposed image's histogram.

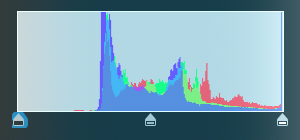
You'll see that the histogram is now bunched to the right, brighter side. More importantly, instead of spanning the entire image, the darkest single pixel is pretty far from the left edge. Our pixels now span 100-255. This is bad because we aren't using the entire dynamic range of the image format, but it's also bad because the image just looks bad!
This is where histogram equalization comes in. We can fix this image by re-stretching out the histogram using this formula. Now the image's pixel values will once again span 0-255 (like the image above).
The results look amazing for large nature photos like this one (source):

But you said it's only for black and white images! That image earlier is clearly colored!
OK, you got me. For ordinary, nature images, you can perform the histogram equalization process for each color channel (RGB) separately, then put them back together into one image. However, for smaller images (100x100 pixels-ish), you may not get good results because the histogram distribution for the 3 colors won't line up well. Here's an example where I histogram equalized my eye, and it looks like I got a black eye.
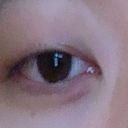
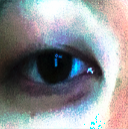
You should see the other guy
That's all for now. Cya!