Trying out various peak detection techniques for the SSVEP
Published January 18, 2021
Today I tried a bunch of techniques to try and detect SSVEP peaks in long streams of EEG data.
My data came from three trials were all around 40 seconds long, and involved me staring at an LED blinking at a duty cycle of 50% and frequencies of 18, 35, and 65Hz. The techniques I used were (broadly): single-channel averaging (SCA), phase-rectified signal averaging (PRSA), autocorrelation (AC), and plain ol' power spectral distribution (PSD). Lots of three letter agencies.
Procedure
Data
Since each data file I had was 40 seconds, I first confirmed that using the entire length of data (after a 60Hz notch and a 5-95 bandpass filter) with each technique showed a prominent peak at the frequency of stimulation, as a baseline. If using the entire length of data didn't work, then I was really screwed trying to detect it using less data. The only data to not show a peak at the stim frequency was the 65Hz data, which makes sense because of the small signal size since frequencies past 20 begin to attenuate. The 18Hz was the largest, and the 35Hz followed.
Sliding windows
For practical applications, I'd only be able to record about 5 seconds of data from the EEG before the user gets tired of staring at blinking lights. I wrote a neat function that chunked the 40 second data into overlapping, 5 second data windows. The function then runs one of the above peak detection methods on the 5 second window, and records the peak before moving on to the next 5 second window. This way, I get to see how the techniques fare across all 40 seconds, but still use a realistic time window. These graphs are longitudinal, and they'll be the focus of this post.
We want to see a clear horizontal line at the frequency of interest (FOI) (either 18 or 35 Hz). I'm summing how many times each frequency shows up on the graph, and printing them out in order. I'm defining "SNR" as the number of times the frequency of interest shows up divided by the number of times the next, far-off frequency shows up (so 34 and 33 don't count for a 35Hz peak, but 30Hz does). Let's get started!
Experiments
I bet you're wondering what experiments I ran today! I'm glad to show you the graphs.
How do SCA, PRSA, and PSD stack up to each other?
The real question! Let's take a look! All peak detection was performed on a 5 sec sliding window over the entire data stream. Peaks are just frequency with the the max power between 10 and 60Hz. Shown here is the 35Hz data. Specifics of each technique are given below.
-
PSD: uses scipy.signal.welch, default options
-
SCA: 200 sample averaging window, non-overlapping. Welch used after averaging to get PSD.
-
PRSA: 200-wide window, anchor points determined using T=2 (next two points had to be > than last two points). Welch used afterwards for PSD.
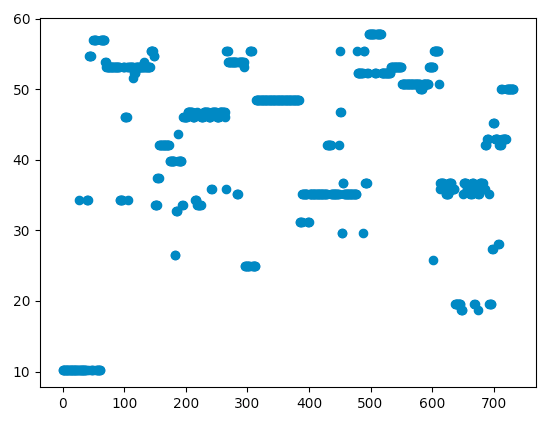
Graph of power spectral distribution of a 35Hz signal, fed in 5s increments and peak detected from 10-60Hz
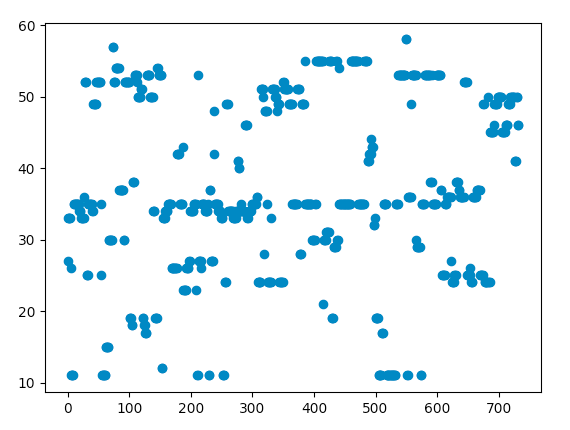
Graph of power spectral distribution of a single-channel averaged 35Hz signal, split in 5s increments and peak detected from 10-60Hz
Graph of power spectral distribution of a PRSA 35Hz signal, split in 5s increments and peak detected from 10-60Hz
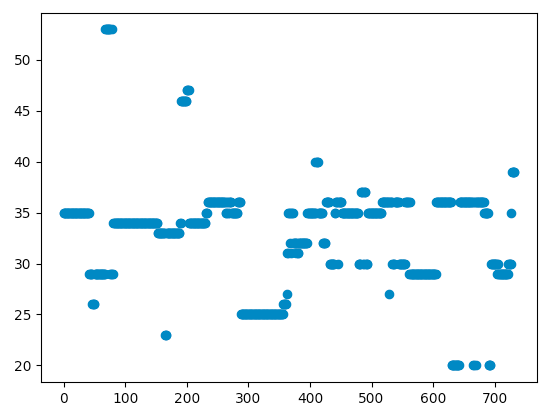
The SNRs are as follows, though from the graph it's pretty clear which one has the best line around 35 Hz (It's the PRSA, the line is clearly there and it's not as noisy as SCA).
-
PSD # SNR 2.8 at 10 sec, 1.0 at 5 sec
-
SCA # SNR 3.7 at 10 sec, 2.0 at 5 sec
-
PRSA # SNR 24.3 at 10 sec, 2.8 at 5 sec
Bonus - Autocorrelation + PSD (Not shown) # SNR 1.35 at 10 sec, 1.1 at 5 sec
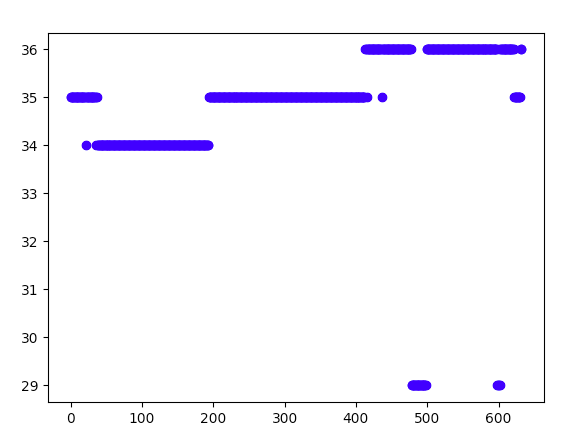
Here's the picture of the PRSA working on a 10 second window of data. It's almost a solid bar, concentrated around 35Hz. This was the best result I got.
Graph of power spectral distribution of a PRSA 35Hz signal, split in 10s increments and peak detected from 10-60Hz. Notice how much nicer it is than the noisy messes above.
Does order of filtering matter for single-channel averaging?
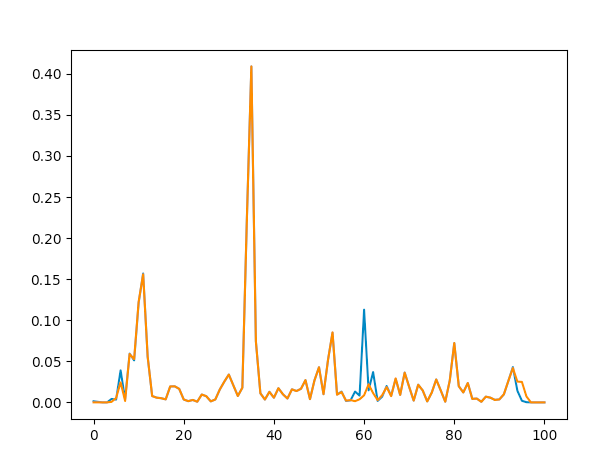
No, except for the notch filter. Here, the blue line shows filtering before averaging, and the orange shows filtering afterwards. We see that the 60Hz makes a comeback if you average after filtering, but it doesn't really affect the rest of the graph at all.
Single channel averaging comparison between filtering before (orange) and after (blue)
Can you use overlapping windows for single-channel averaging?
No. It really heavily concentrates the frequency band you allow it to have (If you do 40 length windows at a sample rate of 200Hz, you get heavy power at ALL multiples of 5Hz, and nowhere else). Completely unusable. The power of each peak isn't even a metric for anything either.
Does autocorrelation improve the ability of the other methods mentioned above, applied before or after?
Not really. Usually makes it worse, but not by much.
Can you use autocorrelation alone for peak detection?
Nah. The autocorrelation is insanely good if you run it on long data windows (think 20+ seconds), but really terrible at windows of less than 10 seconds.
What's the best solution you've found?
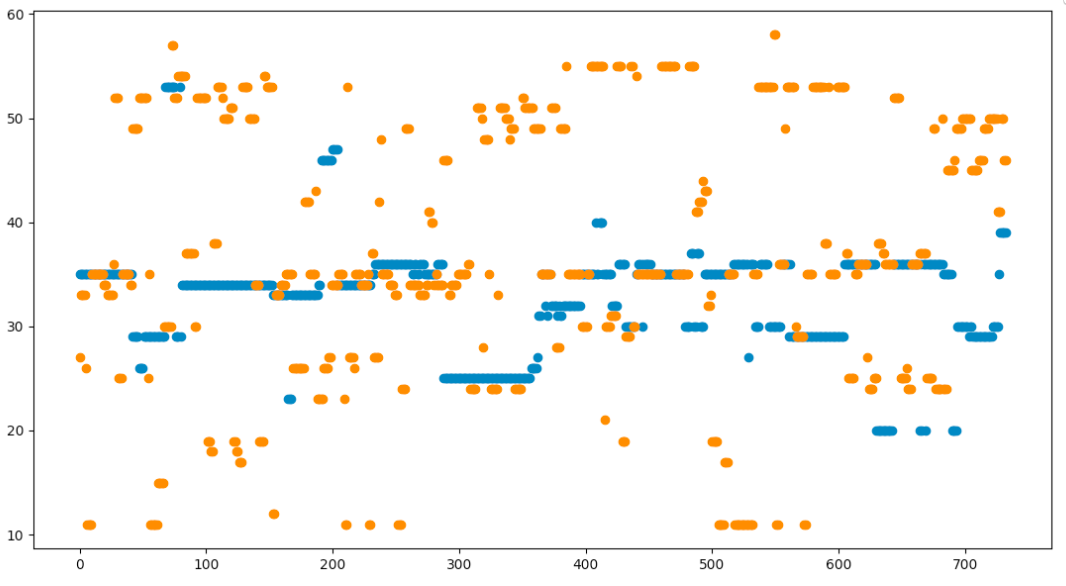
The PRSA definitely takes the cake for best peak detection method I looked at today, but I think that they all suck for short data lengths (<=5 sec). It's quite difficult to get any of them to be consistently active, especially since the SSVEP is so temporally varying anyway.
I think I'm going with the PRSA for now, since it appears to be sort of consistent. Maybe I can do a history-based voting system or something...
Comparison of SCA and PRSA for a 5 second sliding window. SCA is much noisier, and doesn't always help fill in the gaps left by PRSA
Takeaways
These techniques work great for me for more than 10 seconds of data, but that just isn't feasible for real usage. Also it's annoying for me to look at a light for that long.
Next steps
I want to make the PRSA run live. I need to add a peak detection history plot to my GUI.
I also want to try the different wavelength LEDs again. With peak detection, it might be better than just amplitude thresholding or something.
As far as new research goes, I want to try using the Stability Coefficient, empirical mode decomposition, and similary of background. Those are next. EMD removes noise, SC offers decent SSVEP identification accuracy at short data chunks around 1 second (voting system!), and similarity of background is close to SC. I also want to try multiple electrodes, and concat their data as if it's one stream. Then I could use PRSA and get great results from "10 seconds of data".
Ok! Cool, cya around.