How sleep deprivation affects my cognition
Published January 10, 2024
Hello! I've been collecting my Stroop effect data for about three months now, and I also have my Fitbit collecting sleep data from the whole period. A friend asked me how sleep affects my Stroop scores, and I went ahead and set up the analysis.
Stroop effect — quick, name the colors of the words
Methods and Results
Here is a lot of scatterplots where my three Stroop scores (please see above link for more info) are arranged according to some sleep variables (total time in bed, sleep efficiency, time asleep, time awake), and then I do a linear regression for each one.
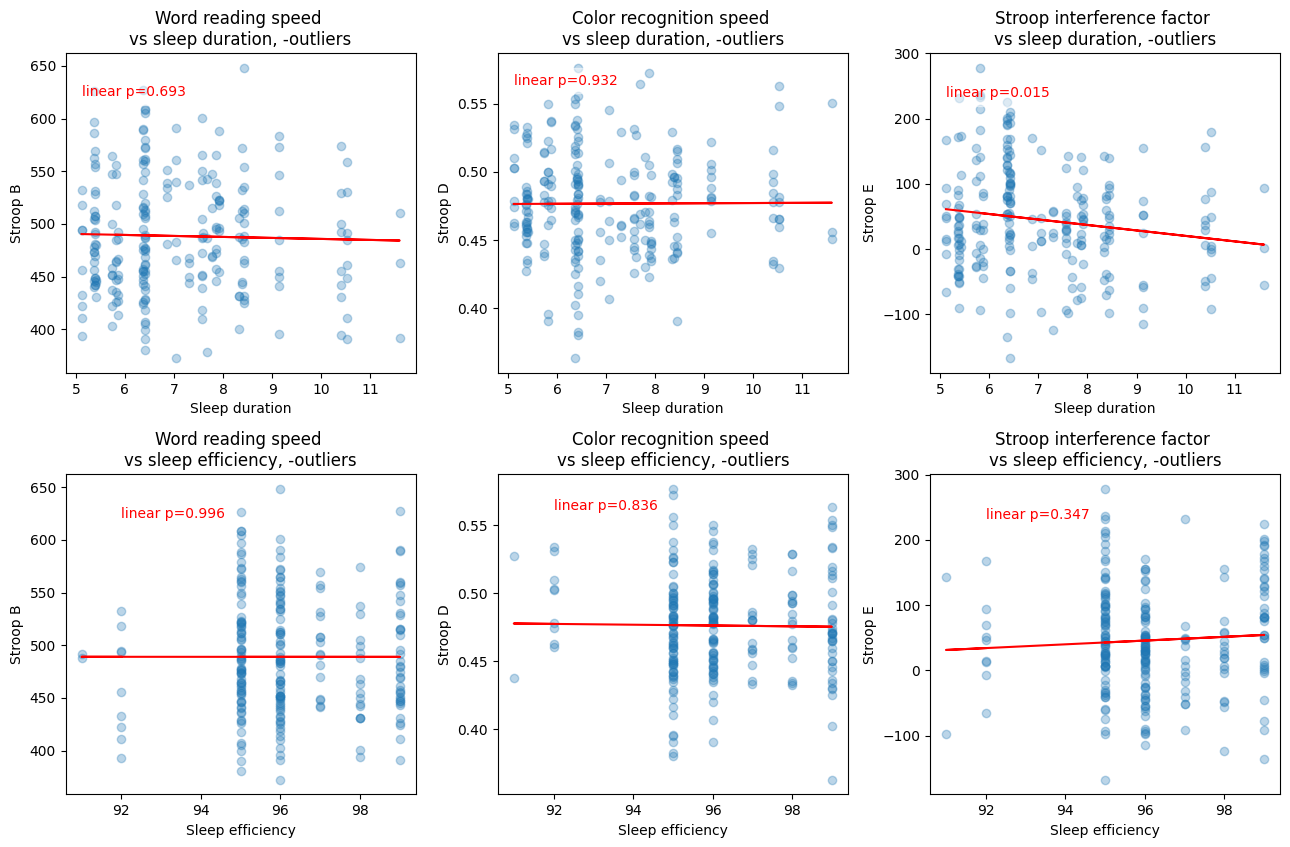
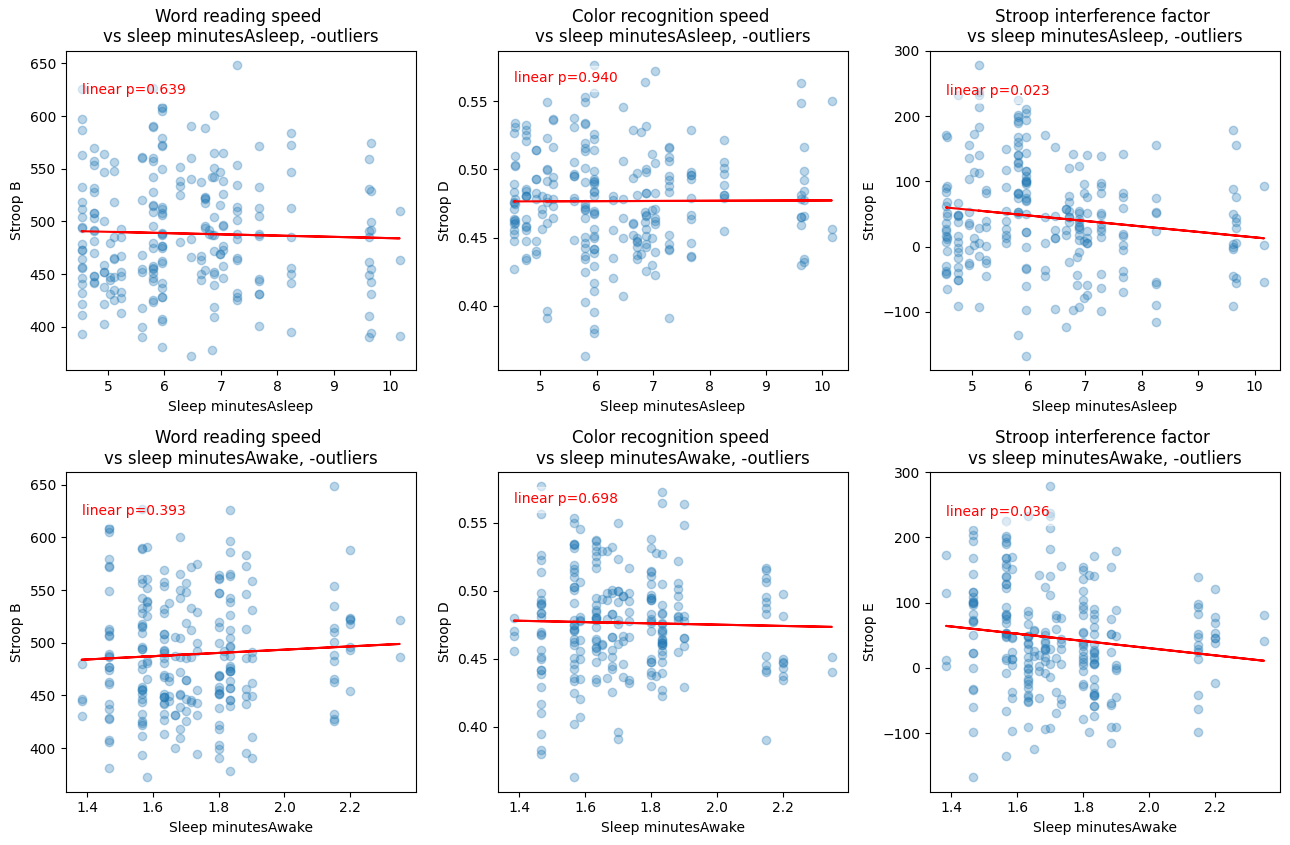
I'm not just gonna throw a best-fit line on there and call it a day — I want to know how real that line is. I've also calculated a p-value which is the probability that the best-fit line slope is that value by random chance. I also Bonferroni-corrected the threshold value, though I think this boundary is a bit arbitrary (we pick p=5% arbitarily like everyone else, then divide by 12 to Bonferroni correct. p<.00416 is significant).
Discussion
As you can see, a few variables appear to be related (most notably Stroop score vs. sleep duration), but aren't actually by our experiment standards. I would need more data to confirm, and I only have 27 days of data because Stroop data is relatively new in my stack of tracked personal info.
If the top-right graph were significant, then we could say that my Stroop interference time goes down with a longer sleep duration. We expect smarter people to have a lower Stroop interference, so if we believe more sleep good then my data shows the expected relationship. However, I've been pondering Guzey's work lately re:sleep deprivation is good, and I hoped to see something surprising. Alas, we will wait for me to generate more data.
Aside or Favor
I need people like you, dear reader, to help me with a project.
If Quantified Self is your thing, I'm working on a dashboard with the ability to upload arbitrary time series data and see how it correlates with your other data. There's other dashboards, but they only accept API-integrated data — our project will be for the people who track their nightly erection duration in an Excel spreadsheet and want to see how their water intake changes the next day.
I've written a bit of framework code for this, OOPy stuff — the code is generalizable enough to work across diverse data, but it lacks polish. If you're interested in using what I've written to analyze your data (code request) or are interested in working on this project and have the time to commit to it (collaboration), please email me! I am trying to bring this dash to fruition for others to use. In particular, please contact me if you know anything about modern software best practices, because I do not.