How Good Are Stock Watchlists Anyway?
Published December 25, 2021
Hello! Long time no see! In this post, I'm going to show y'all the behavior of stocks that were featured on a few of Timothy Sykes' watchlists earlier this year.
Background
I've been out for Winter Break for about 2 weeks now, and I've been thinking about a lot of stuff. I'm going to graduate from college after next semester (hopefully), and it's looking like I'll be attending grad school after taking a gap year. In my gap year, I'd like to learn how to make money without working for someone else (aside: if you have any tips for this please let me know).
One way I'm considering is some algorithmic stock market trading, or at least computer-assisted. While researching this topic online, I stumbled upon several different traders publishing "watchlists" of stocks that they were considering for their own portfolios. These are not guaranteed, but rather stocks that they note as "potentially interesting" for pattern trading.
Now personally, I think pattern trading is bull since all the graphs look the same to me. But I figured I should give these fellas the benefit of the doubt and at least try out their stock watchlists.
Work
I signed up for Alpaca Markets, an algorithmic trading platform that also has a great Python API for real-time and historical stock data. I also browsed Mr. Sykes' old watchlists to get lists of stocks he had been promoting. Luckily, they had last-edited dates, so I could see the stock as it changed.
Using the API, I wrote a little scraper that takes a watchlist and startdate and shows the graphs of the stock prices after Mr. Sykes emailed them out to his eager audience. The results are disappointing.
1. Regular September Watchlist
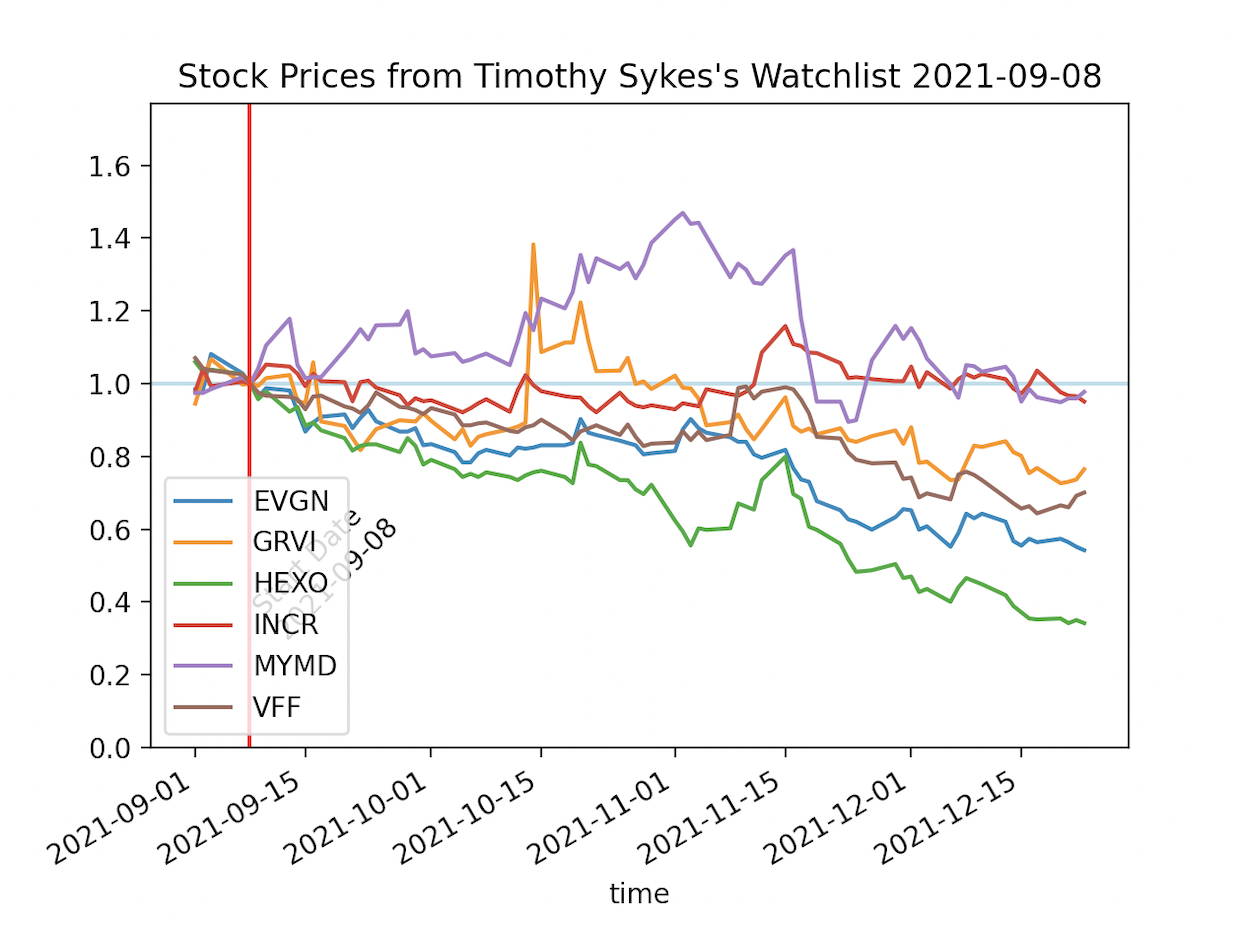
The graphs are all normalized price vs. time graphs, with the vertical red line indicating the date where Mr. Sykes shouted out this stock and the horizontal light blue line indicating a ratio of 1.0, or no price movement at all.
Each stock's history is normalized to the opening price of the stock on the day Mr. Sykes published his watchlist, to simulate a naive investor buying each stock as soon as it gets endorsed.
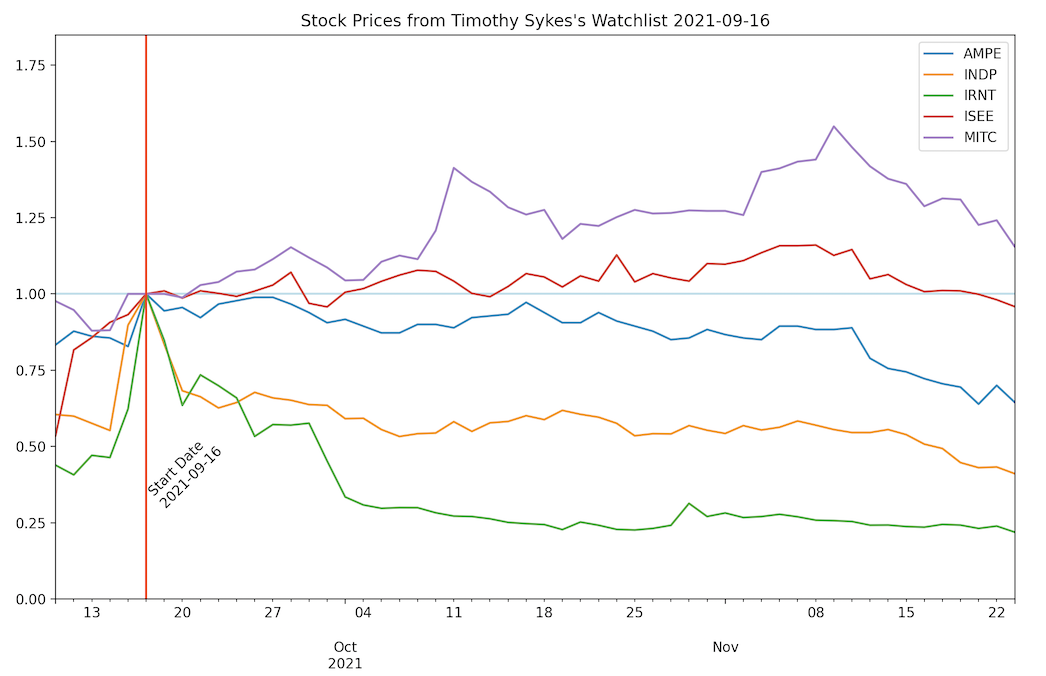 We see that his "Top Stocks to Watch Today: Thursday, September 16" watchlist did not perform so well, only 1 of the stocks above the breakeven mark after 2 months.
We also see the green and yellow spike that happened right before Mr. Sykes watchlisted this stock. While they were already spiking, his shoutout corresponded with even more spiking.
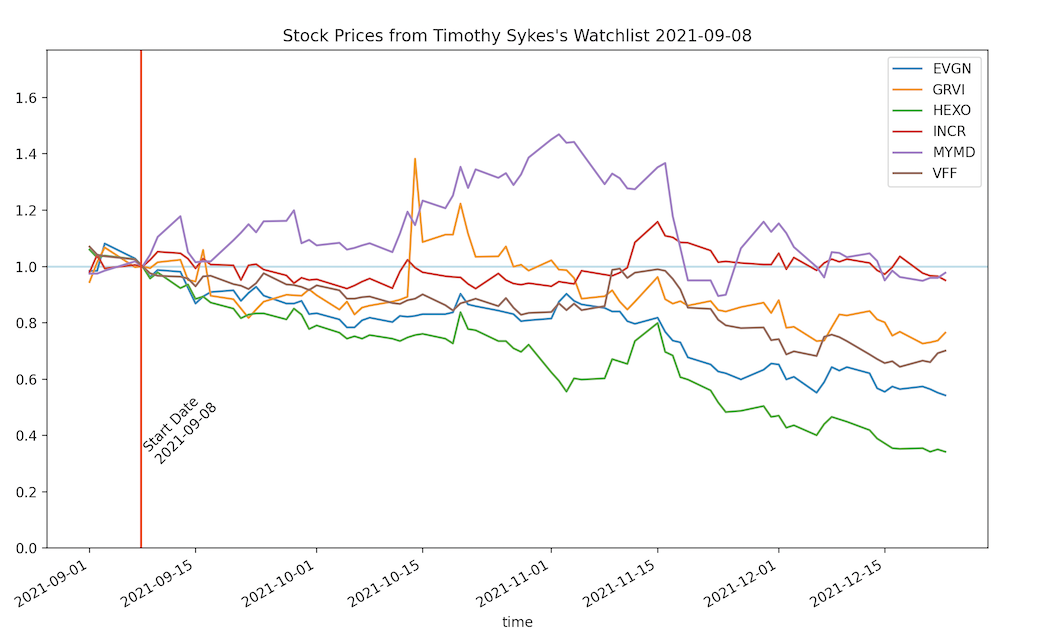
2. Weed Stocks September Watchlist
If you think you're going to make money buying everything on this list, I wanna know what you're smoking and where you're getting it from. Only three stocks ever became profitable, and I'm not even listing the other 4 stocks from the canadian exchange.
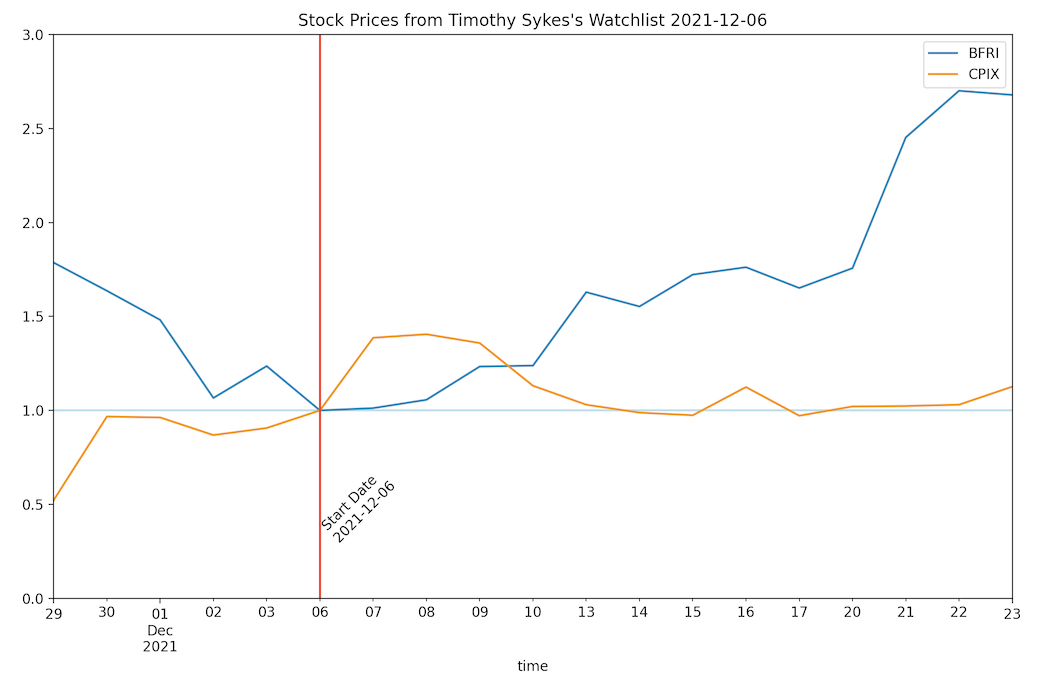
3. Regular December Watchlist
Since only two of the stocks from this watchlist were in Alpaca's records, I made do. His watchlist was published about 3 weeks ago, and it seems that one has been doing very well!
Open vs Close
I looked at only three of Tim's watchlists, chosen by order in which I saw them. However, I wasn't sure whether to post the open or closing prices. Here are the weed stocks, one normalized to open and one to close.
Price normed to close
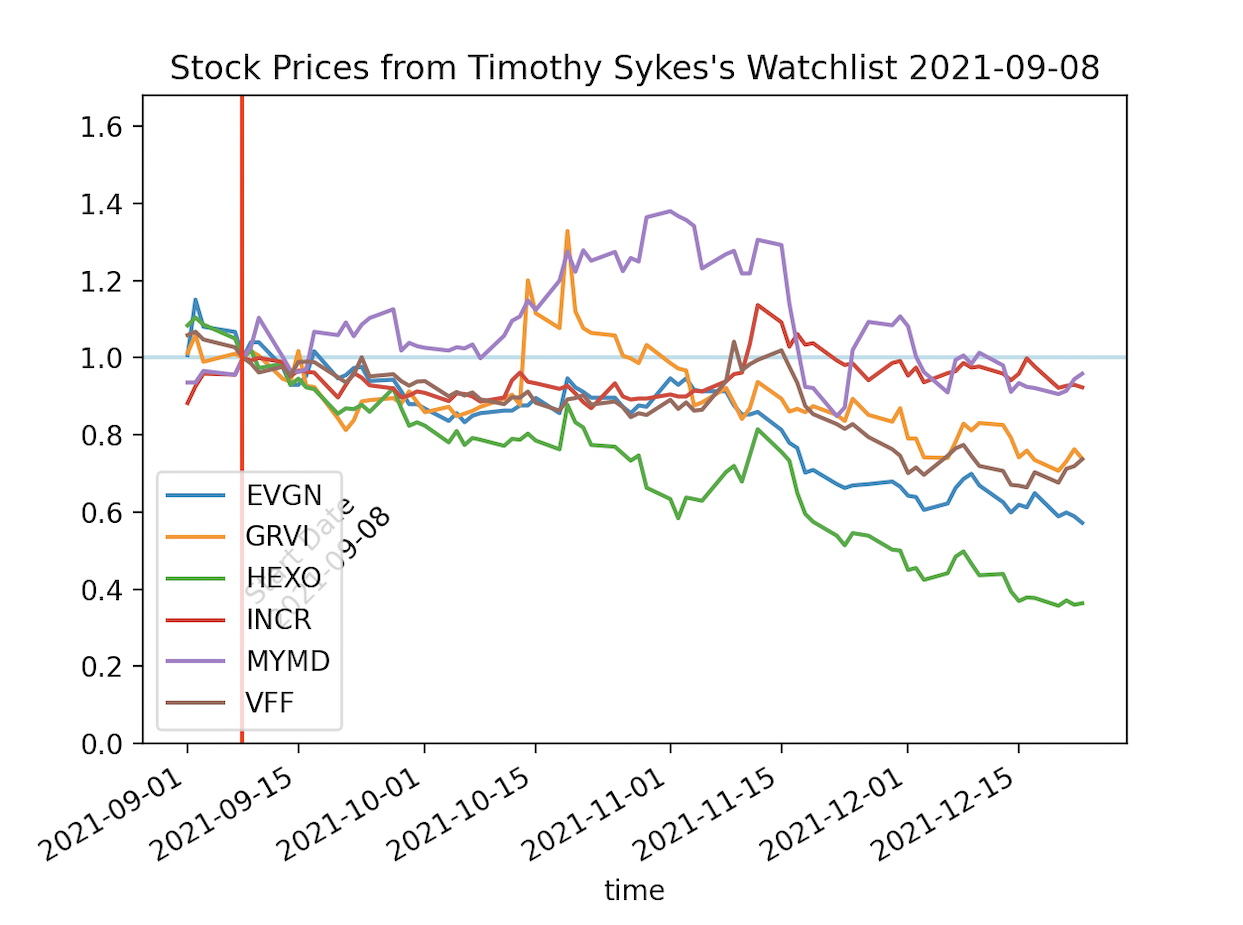
Price normed to open
Conclusion
No nilly-willy buys off some watchlist for me, get some insider trading if you can. And since all the stocks seem to go down, maybe Mr. Tim is just a great short salesman.
Cya next time!