Working with BrainFlow pt. 1
Published December 30, 2020
TL;DR: The OpenBCI GUI sucks, I show you how to stream Ganglion data to Python through BrainFlow to make your own GUI.
Why would you want to make your own?
For whatever reason, the OpenBCI GUI feels clunky to use, and has bad digital filtering. So aesthetics. Also, when I reimplemented the filters in Python Scipy, I got much better FFT peaks, SNR, etc. I wanted to make my own version of the GUI so I could get useful results out of it.
A month ago, the website said to use a combination of pySerial and their own library, pyOpenBCI. I didn't do it at this time because it looked complicated. I went back today and realized that they deprecated this old guide. Hurrah!
BrainFlow
They migrated over to this thing called BrainFlow, which had a lot of setup code but only required one library. BrainFlow also offers filtering, and some other stuff that scipy doesn't for 1D data, like wavelet denoising. Now, personally I don't understand wavelet denoising at all, so I am going to do some reading before using that. However, this library is a good thing. It seems like a lot of cheaper hobbyist headsets are already on this platform, and that makes it all the easier to use. Their examples are also excellent, and work (sort-of)
Today, I set up the GUI (which is really just a live plot), and compared the BrainFlow FFT to Scipy's.
GUI Setup
I wrangled some matplotlib plots and added them to an animation so they'd update live. Turns out calling fig.tight_layout() takes like 80ms, which really slowed down my plotting time (10FPS tops). However, if you take out fig.tight_layout() from your animation loop, the plot axes start drawing over themselves!
Plot axes overlapping, making your plot an illegible mess from hell
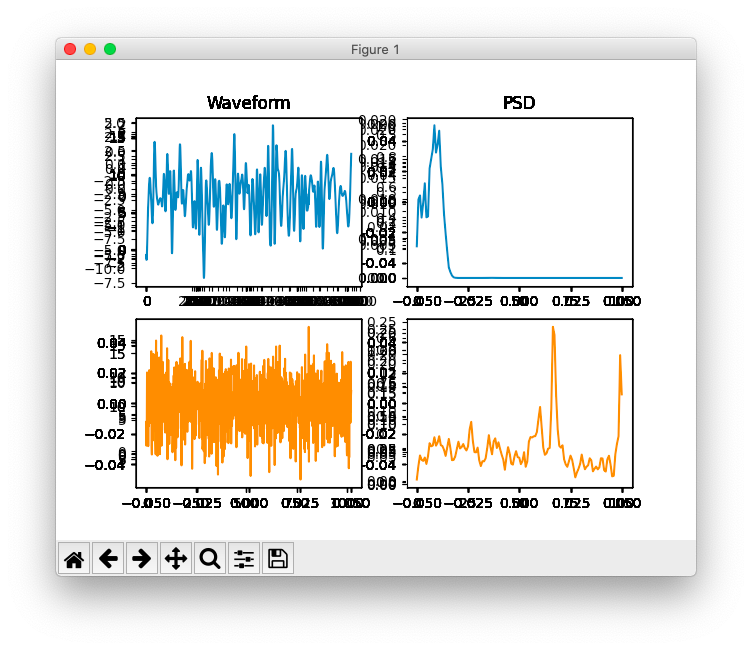
Turns out the tight_layout() call notifies the figure that the background is stale (literally a boolean attribute of matplotlib.Figure called stale) and needs to be redrawn. I had left blit=True because I wanted good speed, and I guess that makes the background not redraw every loop. IDK, I read the code and it still didn't make sense.
I solved this by calling fig.set_visible(True), which conveniently turns stale=True and fixes the background. Tada! Now I'm at 50Hz update rate on the graph. Excellent. Now let's see how the filters do
Brainflow params
BrainFlow requires a BrainFlowInputParams() params object to accompany the board id when initializing the "BrainShim" object. This params doesn't need much, but it does need the name of your serial port that your Bluetooth dongle is connected to. This might be hard to find, but I found a one-liner you could run to get the serial port's names as strings. SO post here, but the terminal one-liner is
python3 -m "import serial.tools.list_ports; print([comport.device for comport in serial.tools.list_ports.comports()])"
Works if your base Python has serial pip installed.
FFT fightoff: BrainFlow vs. Scipy
I started off just comparing the FFTs. I used a window of 256, an overlap of 128, and a Blackman Harris window (Scipy's was 256, but I feel like I used that wrong...). The results were.... complicated.
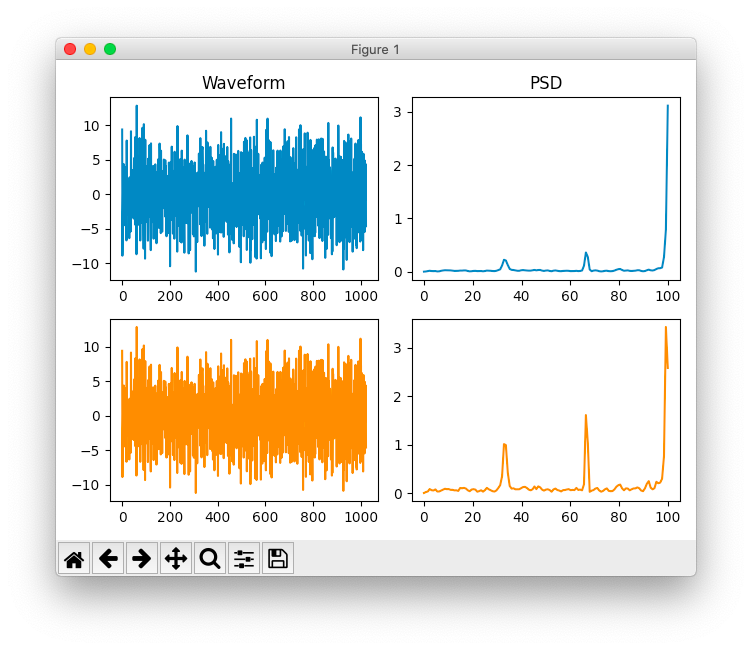
Sometimes the peaks were comparable, but Scipy's would be much clearer among the taller peaks of noise
BrainFlow vs. Scipy PSD/FFT using Welch's method
Other times, the BrainFlow plot would have higher peaks for some frequencies, and lower peaks for others.
BrainFlow vs. Scipy PSD/FFT using Welch's method
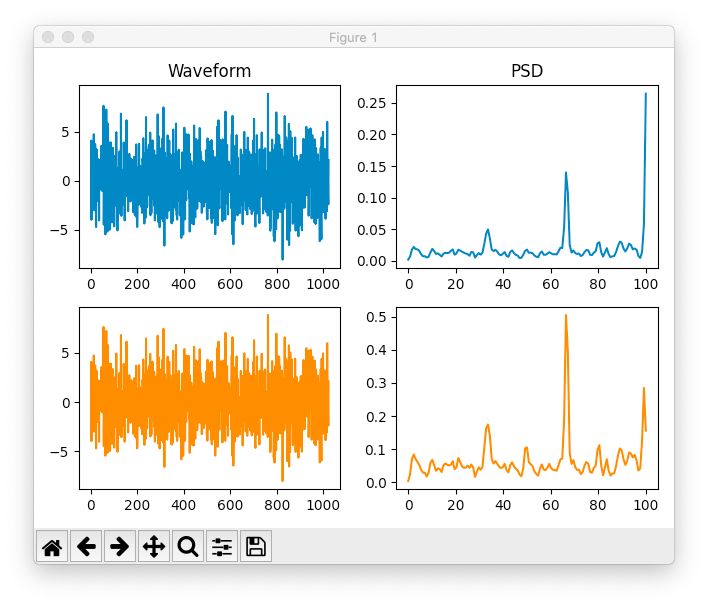
I think Scipy's graphs looked cleaner, even if they were a little noisier. The peaks were higher, which is what I really wanted. I would've liked to quantitatively chosen, but since I just sampled the air, I couldn't get SNR of anything since there was no signal to compare to. Oh well. It's small dice anyway, considering if the signal is awfully noisy we can't get anything out anyway.
Until next time!