Fast automated mobile E2E testing — the unwritten manual
Published May 13, 2026
Most "drive your phone with code" stacks (XCUITest/WDA, uiautomator, Appium, mobile-mcp) work by taking a snapshot of the UI tree, parsing it, and tapping coordinates from the result. That works. It is also dramatically slower than it has any right to be — by default. This is the document I wanted before I started.
Concrete numbers from one app (SwiftUI iOS + Compose Android):
| chain | unoptimized | optimized | speedup |
|---|---|---|---|
Android launch → advanced settings |
14.0s | 5.3s | 2.6× |
iOS launch → advanced settings |
14.4s | 4.9s | 2.9× |
iOS deep-link launch → advanced |
— | 1.25s | 11.5× |
| Android E2E suite (8 tests) | 161s | 54s | 3.0× |
| iOS E2E suite (8 tests) | 175s+ | 56s | 3.1× |
Same hardware, same tests, no parallelism, no flaky-test retries.
{
  "headline_chains": [
    {"chain": "Android: launch → advanced settings",     "before_s": 14.0, "after_s": 5.3,  "speedup": 2.6},
    {"chain": "iOS: launch → advanced settings",         "before_s": 14.4, "after_s": 4.9,  "speedup": 2.9},
    {"chain": "iOS: launch → advanced (deep link)",      "before_s": 14.4, "after_s": 1.25, "speedup": 11.5},
    {"chain": "Android E2E suite (8 tests)",             "before_s": 161,  "after_s": 54,   "speedup": 3.0},
    {"chain": "iOS E2E suite (8 tests)",                 "before_s": 175,  "after_s": 56,   "speedup": 3.1}
  ]
}
The wins come from a small set of repeating patterns. Here they are.
Table of Contents
1. 1. The four phases of any UI step2. 2. SEE — making the snapshot cheap
3. 3. ACT — the hidden quiescence tax
4. 4. VERIFY — never silent-pass
5. 5. DECIDE — surviving UI rotation
6. 6. RECOVERY — the things that break
7. 7. DELAYS — sleep is the enemy
8. 8. ARCHITECTING for testability — existing app vs greenfield
9. 9. DB / SERVER VERIFICATION — talk directly
10. 10. LATENCY BUDGETS — what to actually measure
11. 11. ITERATION LOOP — the meta-rule
12. 12. TL;DR — defaults to set on every project
1. The four phases of any UI step
SEE → DECIDE → ACT → VERIFY
 ↓      ↓      ↓       ↓
dump  parse  tap   re-read
Every step you write spends time on each phase. Most slow tests are slow because SEE dominates and VERIFY is omitted. Most flaky tests are flaky because VERIFY is wrong. Most stale tests rot because DECIDE hard-codes UI strings.
Optimize them in this order:
- SEE is the budget killer. Default snapshot tools serialize the entire accessibility tree. On dense screens that's 1-3s on iOS, 2-3s on Android. Your action takes 50ms. Reduce snapshots, scope them, or skip them.
- VERIFY must be loud. Soft warnings ("could not find element X; skipping") = silent failure later. Always have a failing path.
- DECIDE must survive UI rotation. Match on stable identifiers, not human-facing copy. Fall back gracefully when the copy rotates.
- ACT is usually fine. Taps are fast. The hidden tax is the framework's "wait for animations" after each action — kill it.
{
"chart": "phase_breakdown",
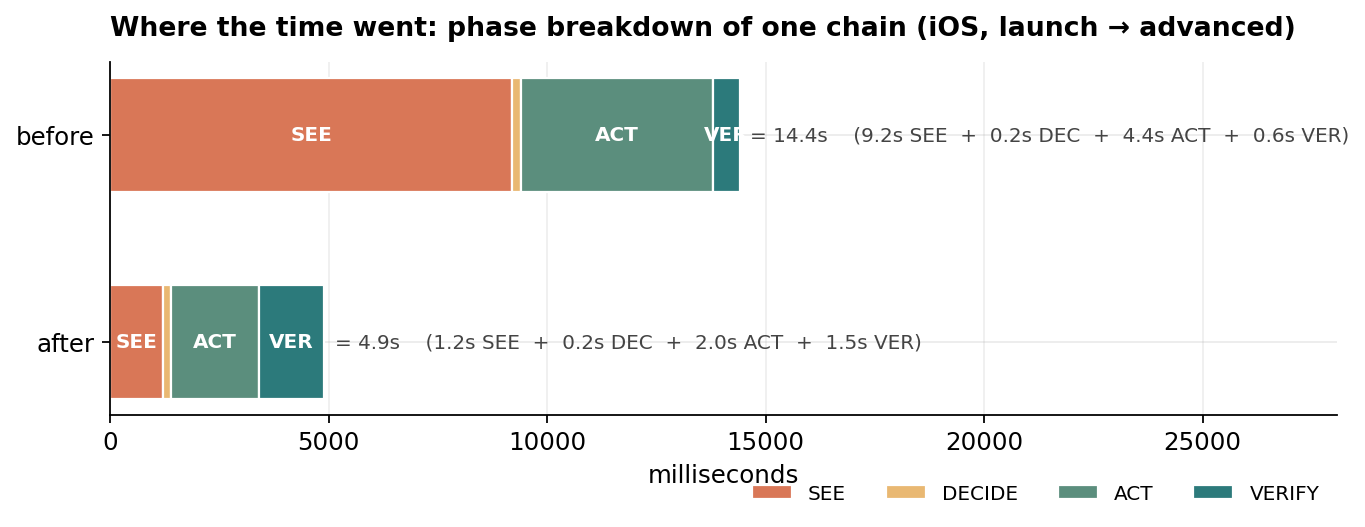
"title": "iOS, launch → advanced — phase breakdown",
"phases": ["SEE", "DECIDE", "ACT", "VERIFY"],
"before_ms": {"SEE": 9200, "DECIDE": 200, "ACT": 4400, "VERIFY": 600, "total": 14400},
"after_ms": {"SEE": 1200, "DECIDE": 200, "ACT": 2000, "VERIFY": 1500, "total": 4900}
}
2. SEE — making the snapshot cheap
The default APIs assume you want everything:
- iOS WDA:
GET /session/$SID/sourcereturns the full UIKit tree as XML. ~1s on a sparse screen, ~3s on a dense one. - Android:
adb shell uiautomator dumpwalks the whole accessibility tree. ~2.2s/call, occasional SIGKILL during animations.
Three escape hatches, in order of preference:
a) Don't snapshot. Use the framework's "find one" endpoint.
Both WDA and uiautomator2-on-device have a per-element find endpoint that runs the predicate server-side and returns just the matched element ID. WDA: POST /element with using: "predicate string". uiautomator2: same idea via JSONRPC.
WDA full /source:                      ~2700ms on a dense screen
WDA POST /element by predicate:        ~300ms
Then click via POST /element/$ID/click. Skips the parse phase entirely.
Catch: predicate find returns ONE match by document order. If the predicate is ambiguous ("Settings" matches both a row and a NavigationBar title), the cached element ID can go stale across a screen transition and your click 404s. Scope by type:
type == "XCUIElementTypeButton" AND name == "Settings"
Same kind of trap on Android — multiple 4h buttons exist if there are multiple charts. Document-order disambiguation works when the chart you want is rendered first; verify with a Y-coord check if it isn't.
b) Persistent on-device server (Android-specific giant win)
adb shell uiautomator dump is slow because it cold-spawns a UIAutomator client every time. The community solved this years ago with openatx/uiautomator2: a tiny on-device JSONRPC server that holds a warm UIAutomator handle and answers dumpWindowHierarchy in ~200ms.
Setup is one command, then the script handles the rest:
pip install uiautomator2
python -m uiautomator2 init   # pushes the .jar to /data/local/tmp/u2.jar
The server is app_process and dies when the spawning shell exits, so detach when starting:
adb shell 'nohup sh -c "CLASSPATH=/data/local/tmp/u2.jar exec app_process / com.wetest.uia2.Main" >/dev/null 2>&1 &'
After that, talk to it via raw HTTP — no Python lib needed in the hot path:
import json, urllib.request
req = urllib.request.Request("http://127.0.0.1:9008/jsonrpc/0",
    data=json.dumps({"jsonrpc":"2.0","id":1,
                     "method":"dumpWindowHierarchy",
                     "params":[False, 50]}).encode(),
    headers={"Content-Type":"application/json"})
xml = json.loads(urllib.request.urlopen(req).read())["result"]
10× faster, zero deps in your script (it's stdlib).
iOS already has this — WDA itself is the persistent server. The lever there is bypassing /source (option a).
c) Skip the snapshot when you don't need it
If you're tapping a known location (bottom-nav tab, a hardcoded coordinate from a stable layout), don't snapshot first. The first source dump of a chain is usually the most expensive — the screen has the most rendered content. Save it.
Hardcoded Pixel 7 bottom-nav coords:
  DASHBOARD_TAB = (264, 2232)
  PROFILE_TAB   = (815, 2232)

Hardcoded iPhone 13 (390×844 logical):
  DEVICE_TAB  = (65, 786)
  PROFILE_TAB = (325, 786)
Re-derive when you change device. Document them with the device model so the next person knows when they're stale.
d) Settings tweaks that compound
Both stacks have settings to bound the snapshot:
- WDA:
POST /session/$SID/appium/settingswithsnapshotMaxDepth: 30, shouldUseCompactResponses: true. Modest but free. - uiautomator2 dump:
params: [compressed=False, max_depth=50]—compressedstrips invisible decoration nodes (only ~7% on Compose UIs, more on legacy Views).
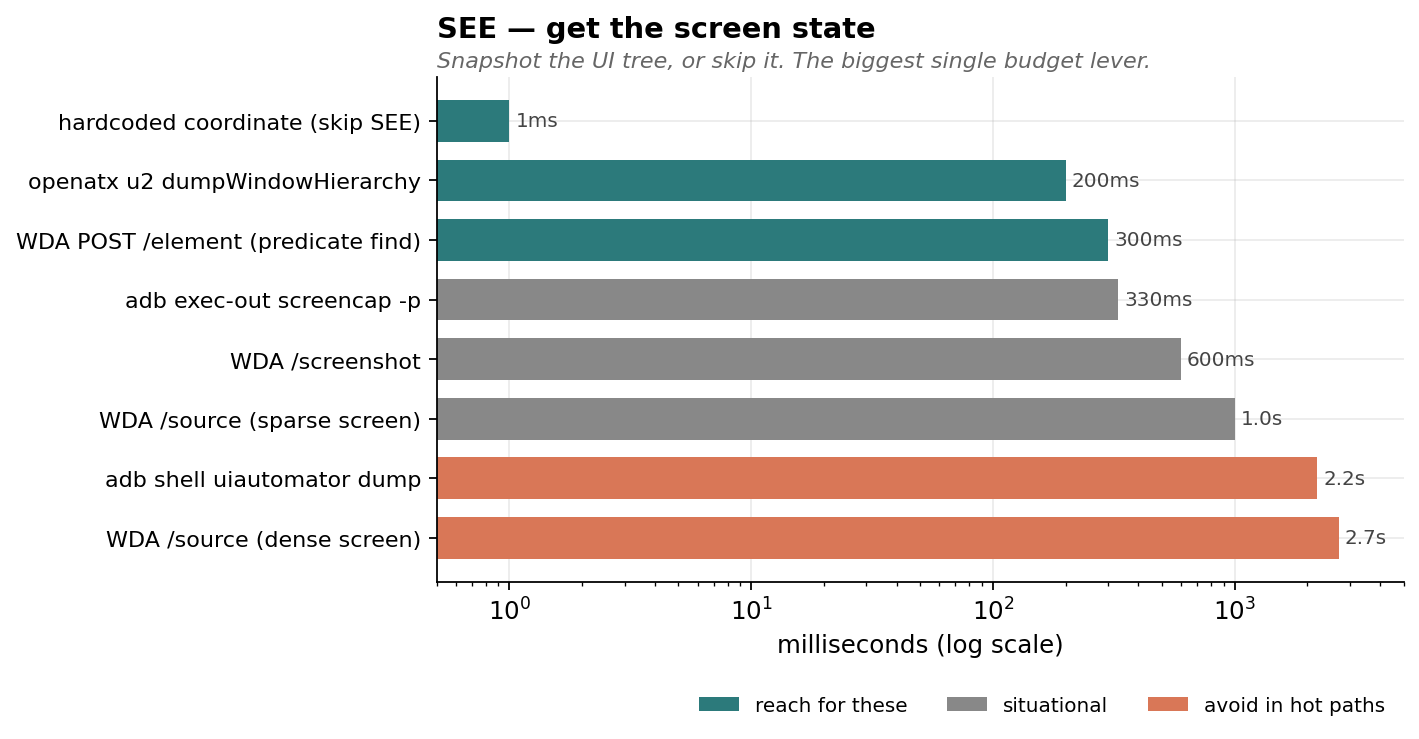
{
  "chart": "see_operations",
  "operations": [
    {"name": "hardcoded coordinate (skip SEE)",      "ms": 1,    "tier": "fast"},
    {"name": "openatx u2 dumpWindowHierarchy",       "ms": 200,  "tier": "fast"},
    {"name": "WDA POST /element (predicate find)",   "ms": 300,  "tier": "fast"},
    {"name": "adb exec-out screencap -p",            "ms": 330,  "tier": "situational"},
    {"name": "WDA /screenshot",                      "ms": 600,  "tier": "situational"},
    {"name": "WDA /source (sparse screen)",          "ms": 1000, "tier": "situational"},
    {"name": "adb shell uiautomator dump",           "ms": 2200, "tier": "slow"},
    {"name": "WDA /source (dense screen)",           "ms": 2700, "tier": "slow"}
  ]
}
3. ACT — the hidden quiescence tax
WDA's biggest non-obvious cost: it waits for the app to be "idle" (no pending animations or async work) AFTER every action. Default ~1.1s per tap. Disable this:
session = POST("/session", {
  "capabilities": {
    "alwaysMatch": {
      "bundleId": "...",
      "waitForIdleTimeout": 0,   # ← single biggest iOS lever
    }
  }
})
Per-tap cost drops to ~0.5s. Across a 4-tap chain that's 2.5s saved.
Android adb shell input tap doesn't have this overhead — it returns in ~70ms. The whole iOS-vs-Android per-tap floor gap (~10×) is essentially this one capability.
You can re-enable selectively when you actually need the wait — for instance, before reading state from a screen that's mid-transition.
{
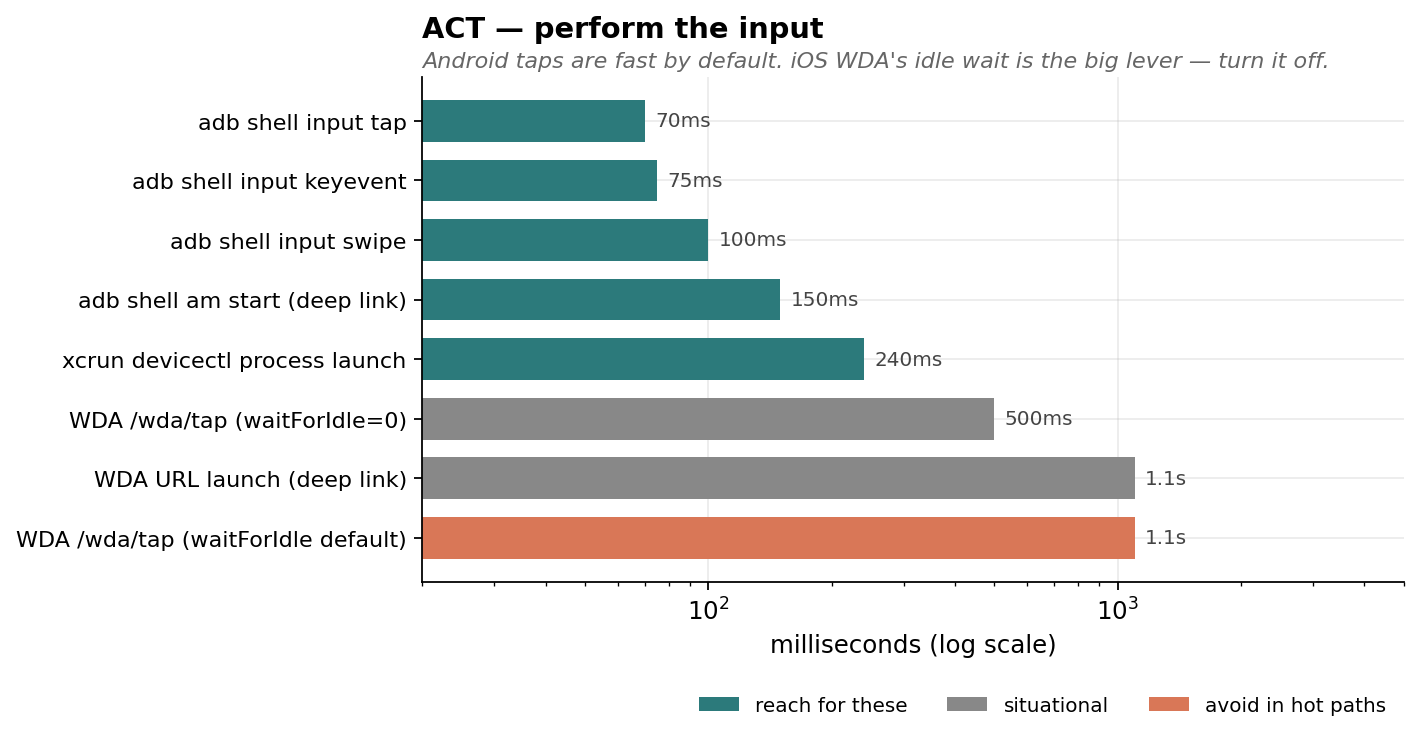
"chart": "act_operations",
"operations": [
{"name": "adb shell input tap", "ms": 70, "tier": "fast"},
{"name": "adb shell input keyevent", "ms": 75, "tier": "fast"},
{"name": "adb shell input swipe", "ms": 100, "tier": "fast"},
{"name": "adb shell am start (deep link)", "ms": 150, "tier": "fast"},
{"name": "xcrun devicectl process launch", "ms": 240, "tier": "fast"},
{"name": "WDA /wda/tap (waitForIdle=0)", "ms": 500, "tier": "situational"},
{"name": "WDA URL launch (deep link)", "ms": 1100, "tier": "situational"},
{"name": "WDA /wda/tap (waitForIdle default)", "ms": 1100, "tier": "slow"}
]
}
4. VERIFY — never silent-pass
The biggest class of mobile-test bugs: tests that "pass" while doing nothing useful. Pattern:
btn = find(text="Device")
if btn:
    tap(btn)
else:
    log.warn("no Device tab; assuming we're already on it")
# ... rest of test runs against whatever screen happens to be up
If the tab gets renamed (we found one called Device that became Daily between two memory-snapshots), the warn fires once, the test continues, and you spend 30 seconds taking screenshots of the wrong screen. The test passes. You don't notice for weeks.
Fix pattern:
for label in ("Daily", "Device", "Dashboard"):     # all known historical names
    btn = find(text=label)
    if btn:
        tap(btn)
        # VERIFY post-tap state with a marker known only to this screen
        if find(text="Heart Rate", kind="StaticText"):
            return
pytest.fail(
    "could not navigate to dashboard — none of "
    "Daily/Device/Dashboard buttons led to a screen with 'Heart Rate'. "
    "Has the tab label rotated again?"
)
The verifier should be:
- Strictly post-condition-shaped ("Heart Rate is visible") not pre-condition-shaped ("the tab button I tapped was the right one").
- Specific to the destination, not generic ("there's a button somewhere").
- Allowed to fail, with a useful message that points the next maintainer at what changed.
Same rule for any optional batch action. A timescale-buttons loop used to do for label in ("4h","1d","1w","2w"): if not _tap(): log.warn(...). We changed it to track misses and pytest.fail if all 4 missed. Silent partial failure → loud total failure.
{
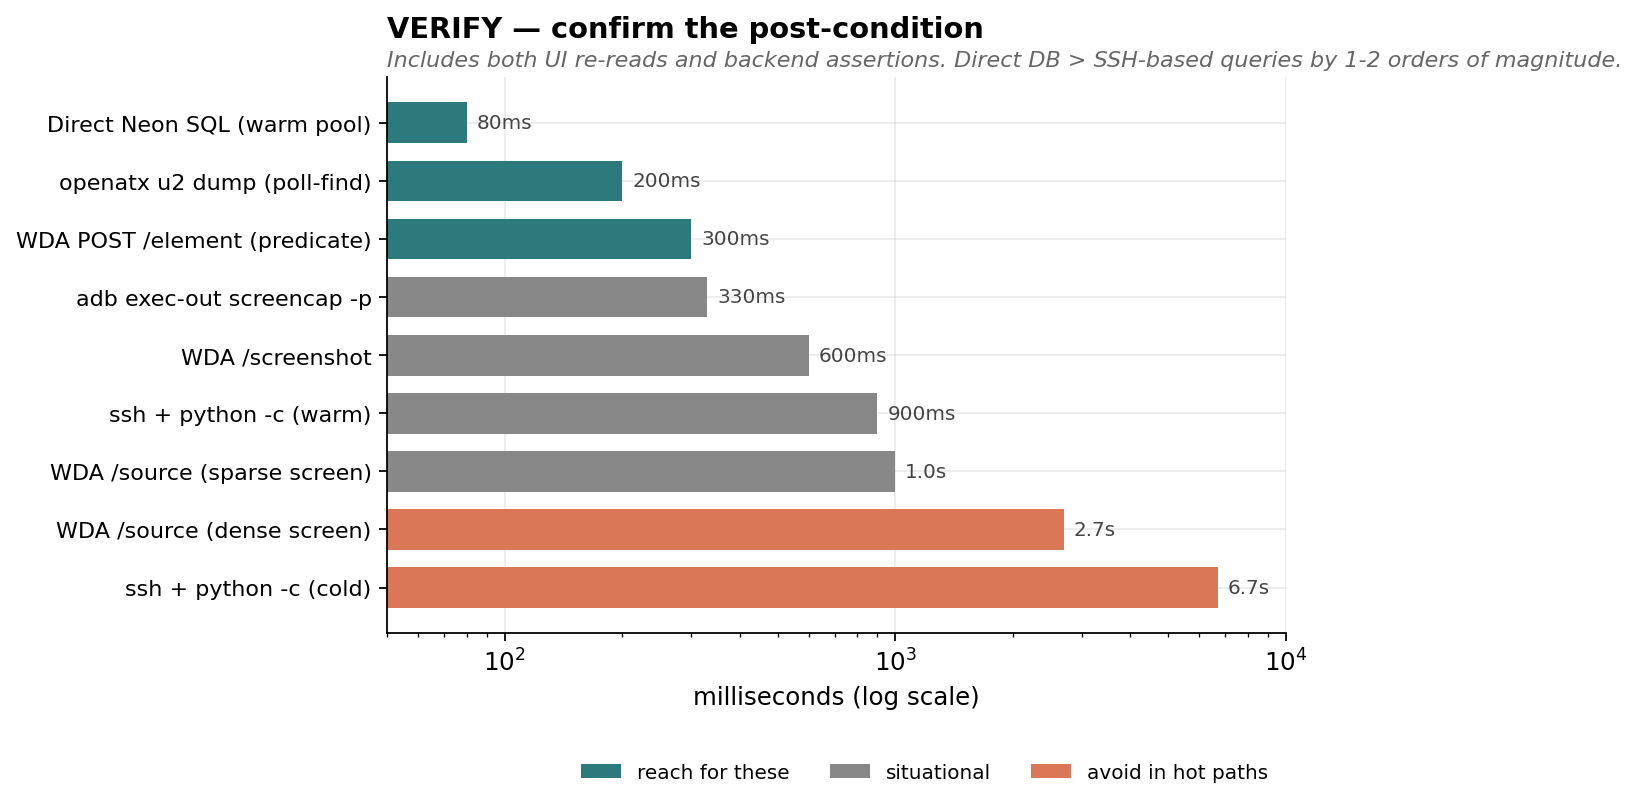
"chart": "verify_operations",
"operations": [
{"name": "Direct managed-DB SQL (warm pool)", "ms": 80, "tier": "fast"},
{"name": "openatx u2 dump (poll-find)", "ms": 200, "tier": "fast"},
{"name": "WDA POST /element (predicate)", "ms": 300, "tier": "fast"},
{"name": "adb exec-out screencap -p", "ms": 330, "tier": "situational"},
{"name": "WDA /screenshot", "ms": 600, "tier": "situational"},
{"name": "ssh + python -c (warm)", "ms": 900, "tier": "situational"},
{"name": "WDA /source (sparse screen)", "ms": 1000, "tier": "situational"},
{"name": "WDA /source (dense screen)", "ms": 2700, "tier": "slow"},
{"name": "ssh + python -c (cold)", "ms": 6700, "tier": "slow"}
]
}
5. DECIDE — surviving UI rotation
Human-facing copy rotates. Three real ones from the same app within 2 weeks:
- "Solar" → "Light exposure" (a segmented control)
- "Device" → "Daily" (a bottom dashboard tab)
- "Account" → "ACCOUNT" (a section header — case sensitivity)
Mitigation:
- Match on accessibility identifier when possible. SwiftUI
.accessibilityIdentifier("dashboard.heartrate.timescale.4h"). ComposeModifier.semantics { testTag = "dashboard.heartrate.timescale.4h" }. Doesn't ship to users; doesn't rotate. - Match on multiple known names.
find(text in {"Daily","Device","Dashboard"}). Cheaper than introducing accessibility identifiers retroactively. - Annotate the test memo with the rename history. When the next rename happens, the maintainer knows to extend the list, not to rewrite the test.
Specific gotchas in our app's stack:
- SwiftUI inline pickers render the selected option's text as a regular StaticText in the Settings list. Useful as a "current value" probe, but you must scope your predicate by type — there's also a NavigationBar title and a compound Button label that include the same string.
- iOS NavigationStack sub-screens have their own NavigationBar with a title that matches the section name.
name == "Settings"matches the Settings row on Profile AND the Settings NavigationBar one screen deeper. WDA picks one and caches its identity; if the screen transitions before you click, it 404s. - Compose Navigation bottom-nav tabs are no-ops when you're already in their sub-graph. Tapping the Profile tab from the Settings sub-screen does NOT pop back to Profile root. Use
KEYCODE_BACKto pop.
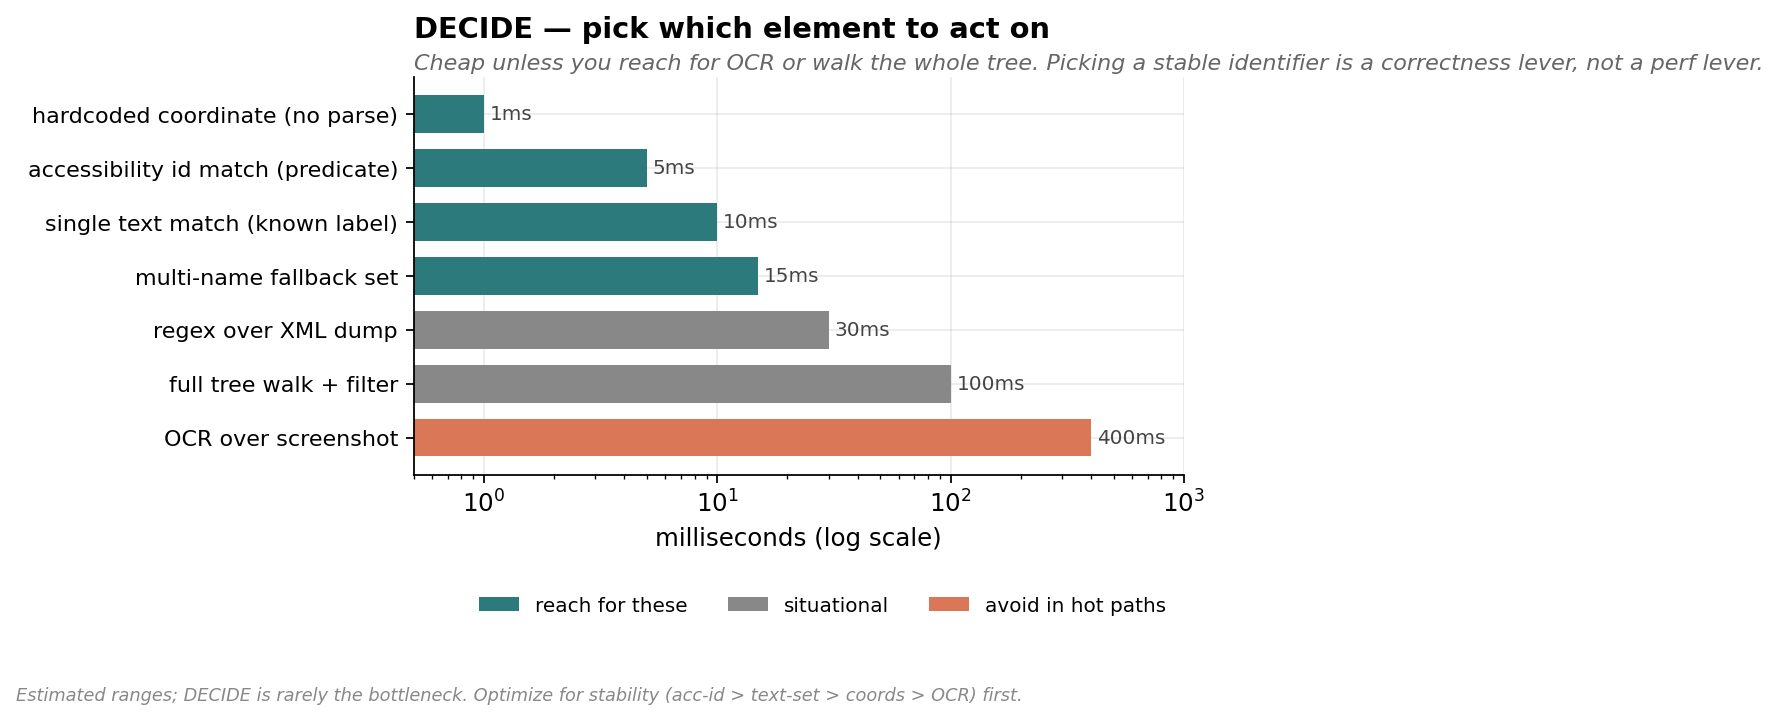
{
  "chart": "decide_operations",
  "note": "Estimated ranges; DECIDE is rarely the bottleneck. Optimize for stability (acc-id > text-set > coords > OCR) first.",
  "operations": [
    {"name": "hardcoded coordinate (no parse)",      "ms": 1,    "tier": "fast"},
    {"name": "accessibility id match (predicate)",   "ms": 5,    "tier": "fast"},
    {"name": "single text match (known label)",      "ms": 10,   "tier": "fast"},
    {"name": "multi-name fallback set",              "ms": 15,   "tier": "fast"},
    {"name": "regex over XML dump",                  "ms": 30,   "tier": "situational"},
    {"name": "full tree walk + filter",              "ms": 100,  "tier": "situational"},
    {"name": "OCR over screenshot",                  "ms": 400,  "tier": "slow"}
  ]
}
6. RECOVERY — the things that break
- WDA dies on app reinstall. The XCTest runner is attached to the previous build of the bundle. Symptom:
curl http://localhost:8100/statusreturnsConnection reset by peer. Recovery: re-runxcodebuild ... WebDriverAgentRunner testand wait forServerURLHere->http://...:8100<-ServerURLHere. Takes ~30-60s. Plan reinstall cycles around this. - adb shows the same Pixel twice when both USB and mDNS-TLS transports come up.
adb shellerrors withmore than one device/emulator(exit 255). Auto-fix: parseadb devices, prefer the USB-style serial (no_adb-tls-connectsuffix), setANDROID_SERIAL, all subprocess calls inherit it. uiautomator dumpSIGKILLs (137) during transitions. Animations confuse the dump. Persistent u2 server doesn't have this problem because it holds a stable handle.am killis a no-op when the app is foregrounded. OS judges foreground apps "important" and silently skips. Combined witham starton the same activity (no-op when already foregrounded), your test_relaunch can do nothing. That's fine for "doesn't crash" intent, but verify foreground state, don't assume the kill happened.am force-stopwipes BLE PendingIntent scans. On our app the rebuild takes 30-50s. Useam killfor "test relaunch hooks",force-stoponly when explicitly testing cold-start recovery.
7. DELAYS — sleep is the enemy
Default reflex when something flakes: add a sleep. Don't.
- If you need to wait for a known event, poll for it. Most "find" helpers already do — write yours that way. Caller code should never
sleepbefore afind(the find polls; pre-sleep is dead time). - If you don't know what you're waiting for, write it down before sleeping. Comments like
time.sleep(1.5) # let chart re-renderaren't decorative — they're a debt that future-you will renegotiate. The honest answer is usually "0.3s is fine". - Cold-start launches really do block. WDA's
POST /wda/apps/launchwaits until the app foregrounds. iOSxcrun devicectl device process launchreturns when the launch kicks off (~240ms) but not when the app is rendered. Read the framework docs for each entry point so you know which it is.
After the sleep audit, our two suites went from 175s+ to ~55s with no reliability cost. About 30% of that was killing dead sleeps; the rest was the snapshot/predicate work above.
8. ARCHITECTING for testability — existing app vs greenfield
Greenfield
If you control the app source from day 1:
- Add
accessibilityIdentifierto every interactive element. Free at write time, infinitely valuable later. They never rotate, they never get translated, they're invisible to users. - Wire a debug-only deep-link router from the start.
myapp://nav/settings/advanced→navController.navigate(...). Gated to#if DEBUG/BuildConfig.DEBUG. ~10-15 lines of code. Pays for itself the first time you skip a 5-step manual nav in CI. - Expose state-altering debug intents — clear cache, set feature flag, jump app to an arbitrary state. Beats trying to reach state X by clicking your way there.
- Telemetry-flush on foreground. If you have an event queue, flush it on every
onResume/scenePhase=.active. Tests that assert "this event reached the server" will thank you.
Existing app
Don't rewrite. Layer on:
- Predicate-find + element-click path before adding
accessibilityIdentifiers. You don't need source changes. - Add a debug deep-link route for the routes the test suite uses most. It's surgical. Even just
app://nav/settingsandapp://nav/advancedsaves seconds × N tests × M runs/day. Gate to debug builds — production builds don't expose nav routes. - When you DO add accessibility identifiers, do it test-first. Add the identifier, switch the test to use it, observe the speedup, move on. Don't bulk-annotate.
The cost-benefit on a debug deep-link router for an existing app:
launch + nav (WDA tap-and-poll, optimized):  ~5s
launch + deep link:                          ~1.2s

Per-test savings:                            ~3.8s
Code change:                                 ~30 lines, gated to DEBUG
Days to break even (1 CI run/day):           ~1
9. DB / SERVER VERIFICATION — talk directly
Most E2E tests need to confirm "the data made it to the backend". Common pattern: shell into the backend, run a query, parse the output. We did this with ssh prod && python -c "..." for two weeks before realizing:
- Cold call: ~6.7s (SSH connect + remote Python startup + sqlalchemy import + DB connect)
- Warm call: ~0.9s (sqlalchemy still imports per call)
Direct connection with a cached engine on the test runner:
- Cold call: ~1.3s (TLS + auth)
- Warm call: ~50-150ms (engine + connection pool reuse)
Most modern managed DBs are publicly addressable — Neon, Supabase, RDS-with-public-endpoint. The URL is the only secret. Stash it in a gitignored file or env var; share the file path across the test suite via a small _get_pg_url() helper that falls back gracefully:
1. POSTGRES_URL env var
2. local cache file (gitignored)
3. one-time fetch (e.g. ssh + grep) that auto-populates the cache
A cached SQLAlchemy engine at module level keeps the connection pool warm across tests in the same pytest session.
Side benefit we didn't expect: the SSH path was silently swallowing a "column does not exist" error in one of our queries. Direct path failed loudly the first time. Prefer code paths that fail loudly.
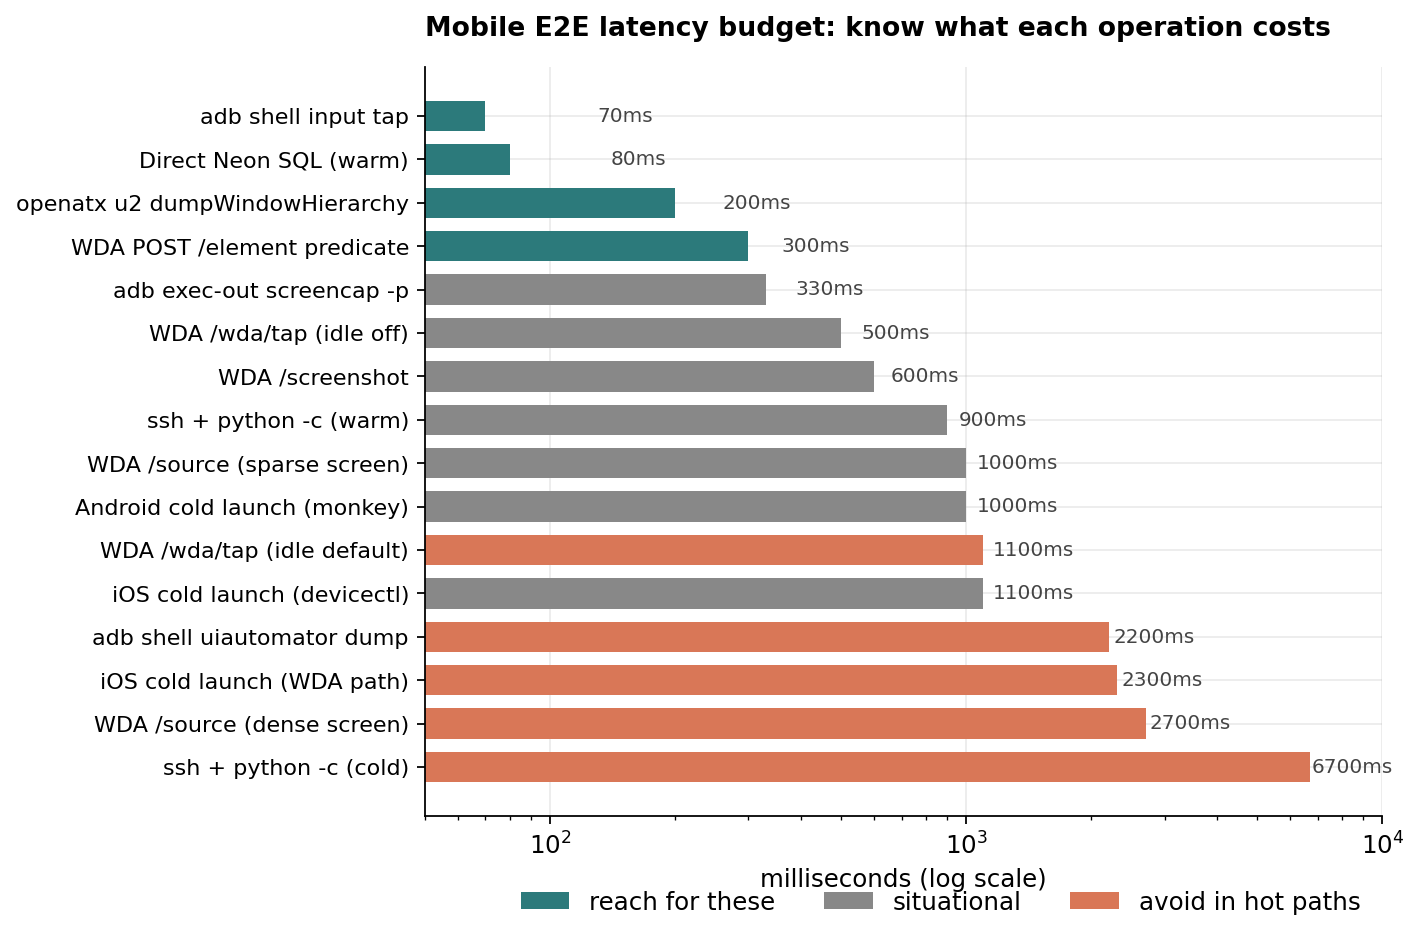
10. LATENCY BUDGETS — what to actually measure
Chains of mobile actions are made of:
| component | typical cost |
|---|---|
adb shell input tap | ~70ms |
WDA /wda/tap (idle wait off) | ~500ms |
WDA /wda/tap (idle wait default) | ~1100ms |
adb shell uiautomator dump | ~2200ms |
openatx u2 dumpWindowHierarchy | ~200ms |
WDA /source (sparse screen) | ~1000ms |
WDA /source (dense screen) | ~2700ms |
WDA POST /element predicate | ~300ms |
WDA /screenshot | ~600ms |
adb exec-out screencap -p | ~330ms |
| iOS cold launch (WDA path) | ~2300ms |
| iOS cold launch (devicectl + url) | ~1100ms |
| Android cold launch (monkey) | ~1000ms |
ssh + python -c cold | ~6700ms |
ssh + python -c warm | ~900ms |
| Direct managed-DB SQL warm | ~80ms |
When you write a test, sum the components in your head. If your "tap → wait → tap → wait → assert" budget says 3s but the test takes 12s, find the missing 9s. It's almost always either a snapshot you didn't realize you'd triggered, a quiescence wait you didn't disable, or an SSH call you could've avoided.
{
  "chart": "latency_budget",
  "operations": [
    {"name": "adb shell input tap",                  "ms": 70,   "tier": "fast"},
    {"name": "Direct managed-DB SQL (warm)",         "ms": 80,   "tier": "fast"},
    {"name": "openatx u2 dumpWindowHierarchy",       "ms": 200,  "tier": "fast"},
    {"name": "WDA POST /element predicate",          "ms": 300,  "tier": "fast"},
    {"name": "adb exec-out screencap -p",            "ms": 330,  "tier": "situational"},
    {"name": "WDA /wda/tap (idle off)",              "ms": 500,  "tier": "situational"},
    {"name": "WDA /screenshot",                      "ms": 600,  "tier": "situational"},
    {"name": "ssh + python -c (warm)",               "ms": 900,  "tier": "situational"},
    {"name": "WDA /source (sparse screen)",          "ms": 1000, "tier": "situational"},
    {"name": "Android cold launch (monkey)",         "ms": 1000, "tier": "situational"},
    {"name": "iOS cold launch (devicectl)",          "ms": 1100, "tier": "situational"},
    {"name": "WDA /wda/tap (idle default)",          "ms": 1100, "tier": "slow"},
    {"name": "adb shell uiautomator dump",           "ms": 2200, "tier": "slow"},
    {"name": "iOS cold launch (WDA path)",           "ms": 2300, "tier": "slow"},
    {"name": "WDA /source (dense screen)",           "ms": 2700, "tier": "slow"},
    {"name": "ssh + python -c (cold)",               "ms": 6700, "tier": "slow"}
  ]
}
11. ITERATION LOOP — the meta-rule
You will write more tests than you realize. The cumulative cost of slow tests across a codebase is shocking. Before optimizing, profile:
phases = []
def step(label, fn):
    t0 = time.perf_counter()
    out = fn()
    phases.append((label, (time.perf_counter() - t0) * 1000))
    return out

step("open session",  driver.open_session)
step("source #1",     lambda: driver.source(sess))
step("tap profile",   lambda: driver.tap(sess, *PROFILE_TAB))
...
print(f"{label:24s} {ms:6.0f}ms")
This is 20 lines and it tells you exactly where the time went. Far better than guessing. Keep these probe scripts in your test repo — they pay for themselves the second time the suite slows down.
When the suite is fast enough that the wall time is dominated by the bits you can't change (cold launch, BLE protocol, network round trips), stop. The remaining win is in parallel test execution or hardware, not micro-optimization.
12. TL;DR — defaults to set on every project
If you want the bullet-point cheat sheet:
- WDA session:
waitForIdleTimeout: 0,snapshotMaxDepth: 30,shouldUseCompactResponses: true. - uiautomator: install
pip install uiautomator2 && python -m uiautomator2 init, then talk to localhost:9008 via stdlib HTTP. - Find via predicate, not /source. Scope by type to avoid stale-element traps.
- Hardcode bottom-nav coords for stable tab bars.
- Drop post-tap sleeps when followed by a polling find.
- Verify post-action state with a destination-specific marker.
pytest.fail, notstep_log.warn. - For a test you'll run more than 50 times, add a
#if DEBUGdeep-link route to the destination screen. - Connect to your DB directly from the test runner. Cache the engine at module level.
- Profile your suite with
time.perf_counter()blocks before optimizing.
The above takes one pass to set up; the speedup compounds for the life of the project.